
Last Updated: 2020-11-06
Istio
Istio (https://istio.io/) is an open service mesh that provides a uniform way to connect, manage, and secure microservices. It supports managing traffic flows between services, enforcing access policies, and aggregating telemetry data, all without requiring changes to the microservice code.
Istio gives you:
- Automatic load balancing for HTTP, gRPC, WebSocket, MongoDB, and TCP traffic.
- Fine-grained control of traffic behavior with rich routing rules, retries, failovers, and fault injection.
- A configurable policy layer and API supporting access controls, rate limits, and quotas.
- Automatic metrics, logs, and traces for all traffic within a cluster, including cluster ingress, and egress.
- Secure service-to-service communication in a cluster with strong identity based authentication and authorization.
What you'll build
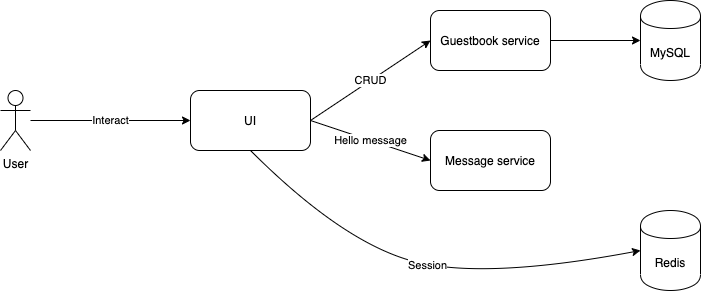
In this codelab, you're going to deploy a guestbook microservice app using Kubernetes and manage it with Istio. Your app will:
- Consist of 3 services
- Use Redis to cache sessions.
- Use MySQL for persistence.
What you'll need
- A recent version of your favourite Web Browser
- Basics of BASH
- Basics of Kubernetes
- GCP Account
Create an Account
In this step, you register for the Google Cloud Platform free trial and create a project. The free trial provides you:
- $300 Credit for Free
- Access to Google Cloud Platform Products
- You Won't be Billed (though you need to enter your credit card)
- Build with the Power, Speed, Security, Reliability, and Scalability of Google
To register for the free trial open the free trial Registration page.
If you do not have a Gmail account, follow the steps to create one. Otherwise, login and complete the registration form.
Read and agree to the terms of service. Click Accept and start a free trial.
Create a Project
Next, create your first project using the Google Cloud Platform Console. The project is used to complete the rest of the lab.
To create a project in the Google Cloud Platform Console, click Select a project > Create a project.
In the New Project dialog: for Project name, type whatever you like. Make a note of the Project ID in the text below the project name box; you need it later. Then click Create.
Upgrade Account (Optional)
In the upper-right corner of the console, a button will appear asking you to upgrade your account. Click Create a Project when you see it. If the Upgrade button does not appear, you may skip this step. If the button appears later, click it when it does.
When you upgrade your account, you immediately have access to standard service quotas, which are higher than those available on the free trial.
Finalize
On the GCP Console, use the left-hand side menu to navigate to Compute Engine and ensure that there are no errors.
At the end of this lab, you may delete this project and close your billing account if desired.
Before you can use Kubernetes to deploy your application, you need a cluster of machines to deploy them to. The cluster abstracts the details of the underlying machines you deploy to the cluster.
Machines can later be added, removed, or rebooted and containers are automatically distributed or re-distributed across whatever machines are available in the cluster. Machines within a cluster can be set to autoscale up or down to meet demand. Machines can be located in different zones for high availability.
Open CloudShell
You will do most of the work from the Google Cloud Shell, a command line environment running in the Cloud. This virtual machine is loaded with all the development tools you'll need (docker, gcloud, kubectl and others) and offers a persistent 5GB home directory and runs in Google Cloud, greatly enhancing network performance and authentication. Open the Google Cloud Shell by clicking on the icon on the top right of the screen:

You should see the shell prompt at the bottom of the window:
Once connected to Cloud Shell, you should see that you are already authenticated and that the project is already set to your project ID.
Run the following command in Cloud Shell to confirm that you are authenticated
gcloud auth listIf it's the first time you are running Cloud Shell - authorize it.
You might need to run the command again after authorization. Command output:
 Credentialed Accounts
ACTIVE  ACCOUNT
*       <my_account>@<my_domain.com>

To set the active account, run:
$ gcloud config set account `ACCOUNT`Check if your project is set correctly.
gcloud config list projectCommand output
[core]
project = <PROJECT_ID>
If it is not, you can set it with this command:
gcloud config set project <PROJECT_ID>Create a Cluster
Enter the following command to create a cluster of machines.
$ export PROJECT_ID=$(gcloud config get-value project)
$ gcloud container clusters create devops-cluster --zone "europe-west1-b" \
--num-nodes 4 --machine-type=e2-medium \
--project=${PROJECT_ID} --enable-ip-alias \
--scopes=gke-default,cloud-platformWhen the cluster is ready, refresh the Kubernetes Engine page in the management console and you should see it.
A node is really just a virtual machine. From the Products and Services menu, choose Compute Engine and you should see your machines.
Get the application sources
Start by cloning the repository for our Guestbook application.
$ cd ~/
$ git clone https://gitlab.com/DmyMi/gcp-k8s-labBuild images and push to GCR
Move into the project directory.
$ cd ~/gcp-k8s-lab/Configure access to GCR from your Cloud Shell by using the gcloud credential helper:
$ gcloud auth configure-dockerBuild the initial versions of images:
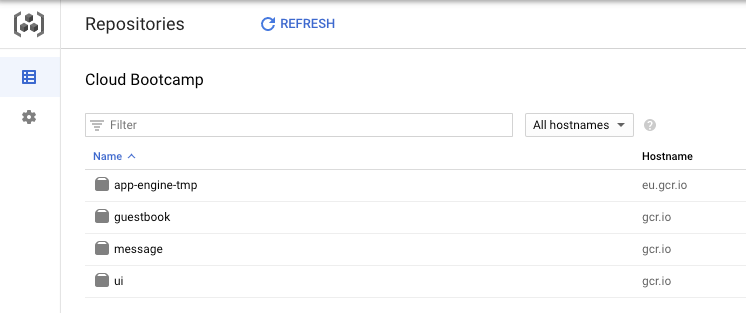
$ ./gradlew jibWhen the command finishes, open a new browser tab and navigate to the Google Cloud Platform console. Navigate to Tools → Container Registry → Images.
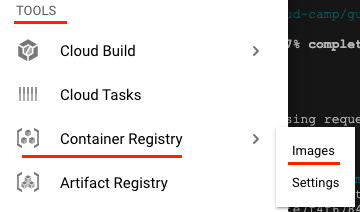
You should see 3 application repositories (ui, message, guestbook) among others in your GCR.
Download Istio
To download Istio CLI and release run the following:
$ cd ~/
$ export ISTIO_VERSION=1.7.4
$ curl -L https://git.io/getLatestIstio | sh -
$ sudo mv istio-${ISTIO_VERSION}/bin/istioctl /usr/bin/istioctlInstall Istio
We can install and manage Istio manually using istioctl, but we will use Istio Operator to automatically install it into our Kubernetes cluster:
$ istioctl operator init --tag "1.7.4"

Using operator Deployment image: docker.io/istio/operator:1.7.4
✔ Istio operator installed
✔ Installation completeWe will use the demo profile while enabling some of the additional features to showcase Istio.
$ kubectl create ns istio-system
$ kubectl apply -f - <<EOF
apiVersion: install.istio.io/v1alpha1
kind: IstioOperator
metadata:
  namespace: istio-system
  name: istio-gke-lab
spec:
  profile: demo
  addonComponents:
    grafana:
      enabled: true
    prometheus:
      enabled: true
    kiali:
      enabled: true
  values:
    global:
      tracer:
        zipkin:
          address: zipkin.istio-system:9411
EOF
You can confirm the Istio control plane services have been deployed with the following commands. Wait for ~1 minute before running:
$ kubectl get all -n istio-systemA lot has been installed!
- Istio Custom Resource Definitions
- Istio Controllers and related RBAC rules
- Prometheus and Grafana for Monitoring
- Kiali for Mesh Visualization
- Istio Sidecar Injector
Finally, add Zipkin for tracing:
$ kubectl apply -f https://raw.githubusercontent.com/istio/istio/release-1.7/samples/addons/extras/zipkin.yamlIstio Proxy Injection
Move into the kubernetes examples directory.
$ cd ~/gcp-k8s-lab/kubernetes/You will be using the yaml files in this directory. Every file describes a resource that needs to be deployed into Kubernetes.
To edit the repository names - execute the following script:
for name in "guestbook-deployment" "message-deployment" "ui-deployment"
do
  /bin/sed "s/PROJECT_ID_GCP/${GOOGLE_CLOUD_PROJECT}/g" "${name}".yaml.tpl > "${name}".yaml
done
Examine the UI Deployment:
$ cloudshell edit ui-deployment.yamlNote that there is nothing but the application container specified.
In order for Istio to intercept the requests, Istio proxy must be installed as a sidecar alongside the application container. There are 2 ways to do this:
- Manual sidecar injection
- Automatic sidecar injection via a Mutating Admission Webhook.
Use istioctl to see what manual sidecar injection will add to the deployment.
$ istioctl kube-inject -f ui-deployment.yaml | less

...
    spec:
      containers:
      - image: gcr.io/project/ui:v1
        ...
      - args:
        ...
        image: docker.io/istio/proxyv2:...
        ...
      initContainers:
      - args:
        ...
        image: docker.io/istio/proxyv2:...
        ...
Notice that the output has more than just the application container. Specifically, it has an additional istio-proxy container, and an init container.
The init container is responsible for setting up the IP table rules to intercept incoming and outgoing connections and directing them to the Istio Proxy. The istio-proxy container is the Envoy proxy itself.
Instead of manual injection, you can also use Automatic Sidecar Injection. This works by using Kubernetes's Mutating Admission Webhook mechanism to intercept new Pod creations and automatically enhancing the Pod definition with Istio proxies.
$ kubectl get MutatingWebhookConfiguration istio-sidecar-injector -oyamlThis configuration points to the istiod service in the istio-system namespace, which is backed by pods managed by the istiod deployment
$ kubectl -n istio-system get svc istiod
$ kubectl -n istio-system get deployment istiod
You can turn on Automatic Sidecar Injection at the Kubernetes namespace level, by setting the label istio-injection to enabled.
$ kubectl label namespace default istio-injection=enabledDeploy the entire application in one shot.
$ kubectl apply -f mysql-stateful.yaml -f mysql-service.yaml --record
$ kubectl apply -f redis-deployment.yaml -f redis-service.yaml --record
$ kubectl apply -f guestbook-deployment.yaml -f guestbook-service.yaml --record
$ kubectl apply -f message-deployment.yaml -f message-service.yaml --record
$ kubectl apply -f ui-deployment.yaml -f ui-service.yaml --record
Check that all components have the Running status, and that Ready column shows 2/2.
$ watch kubectl get podsWhen you are ready, Control+C out of the watch loop.
You can see the sidecar proxy injected into the pod.
$ kubectl get pods -l app=guestbook-service

NAME                                 READY   STATUS    RESTARTS   AGE
guestbook-service-7ff64d7f45-tbrk8   2/2     Running   0          47s
guestbook-service-7ff64d7f45-z758h   2/2     Running   0          47s


# Pick one of the pod from your list, and describe it.
$ kubectl describe pod guestbook-service-...
You should see the initialization containers, and well as a container named istio-proxy automatically injected into the pod.
Ingress Traffic
All of the services now have an internal load balancer. In this lab, you'll expose the UI service via the Istio Ingress. Istio Ingress is not a Kubernetes Ingress controller. I.e., you won't configure Istio Ingress with Kubernetes Ingress definitions.
Find the Istio Ingress IP address.
$ kubectl get svc istio-ingressgateway -n istio-system
$ export INGRESS_IP=$(kubectl -n istio-system get svc istio-ingressgateway \
      -o jsonpath='{.status.loadBalancer.ingress[0].ip}')
$ echo $INGRESS_IP
Connect to the Istio Ingress IP.
$ curl $INGRESS_IP

curl: (7) Failed to connect to ... port 80: Connection refused
The connection is refused because nothing is binding to this ingress.
Bind a Gateway to the Istio Ingress.
$ kubectl apply -f - <<EOF
apiVersion: networking.istio.io/v1beta1
kind: Gateway
metadata:
  name: guestbook-ui-gateway
spec:
  selector:
    istio: ingressgateway # use Istio default gateway implementation
  servers:
  - port:
      number: 80
      name: http
      protocol: HTTP
    hosts:
    - "*"
EOF
An Istio Gateway describes a load balancer operating at the edge of the mesh receiving incoming or outgoing HTTP/TCP connections. The specification describes a set of ports that should be exposed, the type of protocol to use, virtual host name to listen to, etc.
Curl the Istio Ingress IP again, and observed that it's now returning a 404 error.
$ curl -v $INGRESS_IPIt's returning 404 error because nothing is binding to the Gateway yet.
Create a Virtual Service and bind it to the Gateway.
$ kubectl apply -f - <<EOF
apiVersion: networking.istio.io/v1beta1
kind: VirtualService
metadata:
  name: guestbook-ui
spec:
  hosts:
  - "*"
  gateways:
  - guestbook-ui-gateway
  http:
  - match:
    - uri:
        prefix: /
    route:
    - destination:
        host: ui
EOF
A Virtual Service defines the rules that control how requests for a service are routed within an Istio service mesh. For example, a virtual service can route requests to different versions of a service or to a completely different service than was requested. Requests can be routed based on the request source and destination, HTTP paths and header fields, and weights associated with individual service versions.
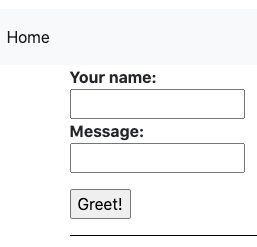
Find the Ingress IP again, and open it up in the browser.
$ echo http://$INGRESS_IPAnd check the UI:
Fault Injection
Let's test how our application deals with upstream errors. Inject a fault to make Guestbook Service reply HTTP 503 error 100% of the time.
$ kubectl apply -f - <<EOF
apiVersion: networking.istio.io/v1beta1
kind: VirtualService
metadata:
name: guestbook-service
spec:
hosts:
- guestbook-service
http:
- route:
- destination:
host: guestbook-service
fault:
abort:
percentage:
value: 100.0
httpStatus: 503
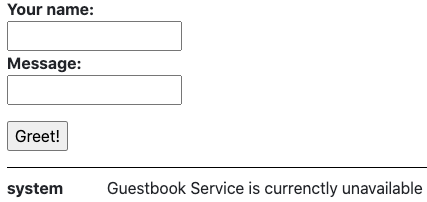
EOFGo back to the browser and refresh the UI page or post a new message. You should see our application handles errors like a boss :).
Simply delete the rule to restore traffic.
$ kubectl delete virtualservice guestbook-serviceLet's try adding a 5 seconds delay to Message Service:
$ kubectl apply -f - <<EOF
apiVersion: networking.istio.io/v1beta1
kind: VirtualService
metadata:
  name: message-service
spec:
  hosts:
  - message-service
  http:
  - route:
    - destination:
        host: message-service
    fault:
      delay:
        percentage:
          value: 100.0
        fixedDelay: 5s
EOF
Try posting a new greeting on the UI page. Observe that now it takes about 5 seconds to complete due to injected delay. Delete the configuration:
$ kubectl delete virtualservice message-serviceRetries & Circuit Breaking
But what if we know the service might be overloaded or otherwise faulty and don't want to implement custom retry logic in the application? Use Istio proxy retry configuration that will automatically keep the connection open while the proxy tries to connect to the real service and retry if it fails.
$ kubectl apply -f - <<EOF
apiVersion: networking.istio.io/v1beta1
kind: VirtualService
metadata:
  name: message-service
spec:
  hosts:
  - message-service
  http:
  - route:
    - destination:
        host: message-service
    retries:
      attempts: 3
      perTryTimeout: 2s
EOF
Also, we can apply a traffic policy to control the volume of connections to our possibly overloaded service and provide a circuit breaker that will control eviction of unhealthy pods from the istio load balancing pool.
$ kubectl apply -f - <<EOF
apiVersion: networking.istio.io/v1beta1
kind: DestinationRule
metadata:
  name: message-service
spec:
  host: message-service
  trafficPolicy:
    connectionPool:
      tcp:
        maxConnections: 100
      http:
        maxRequestsPerConnection: 10
        http1MaxPendingRequests: 1024
    outlierDetection:
      consecutiveErrors: 7
      interval: 5m
      baseEjectionTime: 15m
EOF
Here we have a Circuit breaker implementation that tracks the status of each individual host in the upstream service. Applicable to both HTTP and TCP services. For HTTP services, hosts that continually return 5xx errors for API calls are ejected from the pool for a pre-defined period of time. For TCP services, connection timeouts or connection failures to a given host counts as an error when measuring the consecutive errors metric.
Our rule sets a connection pool size of 100 HTTP1 connections with no more than 10 req/connection to the Guestbook service. In addition, it sets a limit of 1024 concurrent HTTP1 requests and configures upstream hosts to be scanned every 5 mins so that any host that fails 7 consecutive times with a 502, 503, or 504 error code will be ejected for 15 minutes.
Let's test it. Find one of the pods and turn on misbehaviour:
$ export MESSAGE_POD=$(kubectl get pods -l app="message-service" -o jsonpath='{.items[0].metadata.name}')
$ export MESSAGE_POD_IP=$(kubectl get pod ${MESSAGE_POD} -o jsonpath='{.status.podIP}')
$ kubectl run curl --image=curlimages/curl --restart=Never --command sleep infinity
$ kubectl exec curl -c curl -- curl http://${MESSAGE_POD_IP}:8080/misbehave

Next request to /hello/{name} will return a 503
Now let's note the Pod's name and follow the logs to see if the pod is actually misbehaving:
$ echo ${MESSAGE_POD}
$ kubectl logs ${MESSAGE_POD} -c message-service --follow
Go to the UI and refresh it a couple of times or post a few messages.
You should see the messages in console looking like this:
Version 1.0 processed message for Test
misbehaving!
If you compare the hostname of the pod that is misbehaving and the one sending a response in the UI, you should see they are different. Our Virtual Service tried to query the misbehaving pod and when it failed - evicted it from load balancing and routed the request to a working one!
Let's return our pod to normal configuration:
$ kubectl exec curl -c curl -- curl http://${MESSAGE_POD_IP}:8080/behave
$ kubectl delete pod curl
Traffic Splitting / Shifting
Before configuring the traffic splitting, lest modify the application.
Use the Cloud Editor.
$ cloudshell edit ~/gcp-k8s-lab/ui/src/main/resources/templates/index.htmlMake some changes to index.html. Changing the background is always a fun one to try.
Find the style block of body that looks like:
body {
    padding-top: 80px;
}
And change it to:
body {
    padding-top: 80px;
    background-color: goldenrod;
}
Once you've made the changes, build and push a new version of the Docker container.
$ cd ~/gcp-k8s-lab/
$ ./gradlew ui:jib --image=gcr.io/${GOOGLE_CLOUD_PROJECT}/ui:v2
Next, create UI v2 deployment:
$ cd ~/gcp-k8s-lab/kubernetes
$ cat <<EOF >> ui-deployment-v2.yaml
apiVersion: apps/v1
kind: Deployment
metadata:
  name: ui-v2
  labels:
    app: ui
    version: "2.0"
spec:
  replicas: 2
  selector:
    matchLabels:
      app: ui
      version: "2.0"
  template:
    metadata:
      labels:
        app: ui
        version: "2.0"
    spec:
      serviceAccountName: ui-sa
      containers:
      - name: ui
        image: gcr.io/${GOOGLE_CLOUD_PROJECT}/ui:v2
        env:
          - name: MESSAGE_HOST
            value: http://message-service
          - name: GUESTBOOK_HOST
            value: http://guestbook-service
          - name: REDIS_HOST
            value: redis
        readinessProbe:
          initialDelaySeconds: 40
          httpGet:
            path: /actuator/health
            port: 9000
        ports:
        - name: http
          containerPort: 8080
        - name: metrics
          containerPort: 9000
EOF
Install UI v2.
$ kubectl apply -f ui-deployment-v2.yamlWait for v2 pods to be up and running.
$ watch kubectl get pods -lapp=ui,version="2.0"Visit the UI from the browser, and refresh a couple of times.
About 50% of the time you'll see v1 with white background, and the other 50% of the time you'll see v2 with a golden background.
Before you can control traffic splitting between these 2 versions, you first need to define destination subsets. Each subset can have a unique pod selector based on labels.
$ kubectl apply -f - <<EOF
apiVersion: networking.istio.io/v1beta1
kind: DestinationRule
metadata:
  name: ui
spec:
  host: ui
  subsets:
  - name: v1
    labels:
      version: "1.0"
  - name: v2
    labels:
      version: "2.0"
EOF
Once you have the subsets defined, you can configure weight-based traffic split for the different subsets. First, shift all traffic to v1.
$ kubectl apply -f - <<EOF
apiVersion: networking.istio.io/v1beta1
kind: VirtualService
metadata:
  name: guestbook-ui
spec:
  hosts:
  - "*"
  gateways:
  - guestbook-ui-gateway
  http:
  - match:
    - uri:
        prefix: /
    route:
    - destination:
        host: ui
        subset: v1
      weight: 100
EOF
Go back to the browser and refresh several times. Confirm that all traffic is now going to v1.
You can update the weight as you need. Shift 80% of the traffic to v2.
$ kubectl apply -f - <<EOF
apiVersion: networking.istio.io/v1beta1
kind: VirtualService
metadata:
  name: guestbook-ui
spec:
  hosts:
  - "*"
  gateways:
  - guestbook-ui-gateway
  http:
  - match:
    - uri:
        prefix: /
    route:
    - destination:
        host: ui
        subset: v1
      weight: 20
    - destination:
        host: ui
        subset: v2
      weight: 80
EOF
Refresh the UI like 10 times :).
You can also use Virtual Service to direct traffic based on the request data from the header, URI, or HTTP method. Shift all traffic from Chrome browser to v2, and other browsers to v1.
$ kubectl apply -f - <<EOF
apiVersion: networking.istio.io/v1beta1
kind: VirtualService
metadata:
  name: guestbook-ui
spec:
  hosts:
  - "*"
  gateways:
  - guestbook-ui-gateway
  http:
  - match:
    - uri:
        prefix: /
      headers:
        user-agent:
          regex: ".*Chrome.*"
    route:
    - destination:
        host: ui
        subset: v2
  - match:
    - uri:
        prefix: /
    route:
    - destination:
        host: ui
        subset: v1
EOF
Try loading the UI page from a Chrome browser vs another one (Firefox or Safari).
Clean up the Destination Rule & Deployment v2, and reset the Virtual Service:
$ kubectl delete deployment ui-v2
$ kubectl delete destinationrule ui
$ kubectl apply -f - <<EOF
apiVersion: networking.istio.io/v1beta1
kind: VirtualService
metadata:
  name: guestbook-ui
spec:
  hosts:
  - "*"
  gateways:
  - guestbook-ui-gateway
  http:
  - match:
    - uri:
        prefix: /
    route:
    - destination:
        host: ui
EOF
Traffic Mirroring
Traffic mirroring, also called shadowing, is a powerful concept that allows feature teams to bring changes to production with as little risk as possible. Mirroring sends a copy of live traffic to a mirrored service. The mirrored traffic happens out of band of the critical request path for the primary service.
First, deploy a new version of the Message Service. It's going to be the same container, but with different configuration:
$ kubectl apply -f - <<EOF
apiVersion: apps/v1
kind: Deployment
metadata:
  name: message-service-v2
  labels:
    app: message-service
    version: "2.0"
spec:
  replicas: 1
  selector:
    matchLabels:
      app: message-service
      version: "2.0"
  template:
    metadata:
      labels:
        app: message-service
        version: "2.0"
    spec:
      serviceAccountName: message-sa
      containers:
      - name: message-service
        image: gcr.io/${GOOGLE_CLOUD_PROJECT}/message:v1
        env:
        - name: DEMO_VERSION
          value: "2.0"
        resources:
          requests:
            cpu: 200m
            memory: 128Mi
        readinessProbe:
          initialDelaySeconds: 40
          httpGet:
            path: /actuator/health
            port: 9000
        livenessProbe:
          initialDelaySeconds: 40
          httpGet:
            port: 9000
            path: /actuator/health
        ports:
        - name: http
          containerPort: 8080
        - name: metrics
          containerPort: 9000
EOF
Next, create a destination rule for our two versions:
$ kubectl apply -f - <<EOF
apiVersion: networking.istio.io/v1beta1
kind: DestinationRule
metadata:
  name: message-service
spec:
  host: message-service
  subsets:
  - name: v1
    labels:
      version: "1.0"
  - name: v2
    labels:
      version: "2.0"
EOF
Finally, create the Virtual Service:
$ kubectl apply -f - <<EOF
apiVersion: networking.istio.io/v1beta1
kind: VirtualService
metadata:
  name: message-service
spec:
  hosts:
  - message-service
  http:
  - match:
    - uri:
        prefix: /
    route:
    - destination:
        host: message-service
        subset: v1
      weight: 100
    mirror:
      host: message-service
      subset: v2
    mirror_percent: 100
EOF
This route rule sends 100% of the traffic to v1. The last part specifies that you want to mirror to the version v2. When traffic gets mirrored, the requests are sent to the mirrored service with their Host/Authority headers appended with -shadow. For example, message-service becomes message-service-shadow.
Also, it is important to note that these requests are mirrored as "fire and forget", which means that the responses are discarded.
You can use the mirror_percent field to mirror a fraction of the traffic, instead of mirroring all requests. If this field is absent, for compatibility with older versions, all traffic will be mirrored.
Go to the UI and post a few messages. Then check the of the Message v2 to see if the requests are being mirrored:
$ kubectl logs `kubectl get pods -l app="message-service",version="2.0" -o jsonpath='{.items[0].metadata.name}'` -c message-serviceYou should see similar log messages showing that we have our requests mirrored:
Version 2.0 processed message for TestBut in UI we get a response from v1.
Egress Traffic
Egress traffic is allowed by default through the setting of Outbound Traffic Policy Mode to ALLOW_ANY. You can change this mode to block all egress traffic by default and allow only specific traffic through.
Reconfigure Istio installation:
$ kubectl apply -f - <<EOF
apiVersion: install.istio.io/v1alpha1
kind: IstioOperator
metadata:
  namespace: istio-system
  name: istio-gke-lab
spec:
  profile: demo
  meshConfig:
    outboundTrafficPolicy:
      mode: REGISTRY_ONLY
  addonComponents:
    grafana:
      enabled: true
    prometheus:
      enabled: true
    kiali:
      enabled: true
  values:
    global:
      tracer:
        zipkin:
          address: zipkin.istio-system:9411
EOF
Wait 20-30 seconds and deploy a Shell pod into Kubernetes. Open a new Cloud Shell tab and run:
$ kubectl run -i --tty ubuntu --image=ubuntu -- bashIn the first Cloud Shell tab, validate that the Pod has status of Running, and the Ready column shows 2/2.
$ watch kubectl get pods

NAME                                 READY   STATUS    RESTARTS   AGE
...
ubuntu                               2/2     Running   0          66s
...When you are ready, Control+C out of the watch loop.
In the second Cloud Shell tab you should've access to the terminal in the pod. Try to update packages:
root@ubuntu:/# apt updateNotice that there are lots of connection errors! This is because all of the egress traffic is already intercepted by Istio and we configured it to block all egress traffic. You need to allow egress to *.ubuntu.com destinations. There are 2 different ways to do this:
- Configure an IP range that should be intercepted by Istio. This will require determining the IP range that the Kubernetes cluster uses for Pod IPs.
- Or, add Service Entry to have fine-grained control over which external services you want to allow.
This lab will do the latter.
But first, let's see if it is actually Istio blocking, or just Ubuntu servers are down.
In the first Cloud Shell tab run:
$ kubectl logs ubuntu -c istio-proxy --followNow, in the second tab (Ubuntu Shell) try running the update again.
root@ubuntu:/# apt updateCheck the logs in the first tab, you should see something like:
... "GET /ubuntu/dists/focal-security/InRelease HTTP/1.1" 502 - ... "security.ubuntu.com" "-" - ... - block_all
... "GET /ubuntu/dists/focal/InRelease HTTP/1.1" 502 - ... "archive.ubuntu.com" "-" - ... - block_all
... "GET /ubuntu/dists/focal-updates/InRelease HTTP/1.1" 502 - ... "archive.ubuntu.com" "-" - ... - block_all
... "GET /ubuntu/dists/focal-backports/InRelease HTTP/1.1" 502 - ... "archive.ubuntu.com" "-" - ... - block_all
The block_all indicates that Istio's Envoy is blocking the request.
When you are ready, Control+C out of the watch loop.
In the first tab, configure a Service Entry to enable egress traffic to *.ubuntu.com.
$ kubectl apply -f - <<EOF
apiVersion: networking.istio.io/v1beta1
kind: ServiceEntry
metadata:
  name: ubuntu
spec:
  hosts:
  - "*.ubuntu.com"
  location: MESH_EXTERNAL
  ports:
  - number: 80
    name: http
    protocol: HTTP
EOF
In the second Cloud shell session that is currently connected to the Ubuntu pod, and try to update packages again and install Curl.
root@ubuntu:/# apt update
root@ubuntu:/# apt install curl -y
Notice that this time, you are able to connect and install curl successfully.
However, whenever you try to connect to the outside that hasn't been whitelisted by Service Entry, you'll get an error.
root@ubuntu:/# curl https://google.comTypically Istio will examine the destination hostname using the HTTP host header. However, it's impossible to examine the header of a HTTPS request. For HTTPS requests, Istio uses SNI to inspect the host name instead.
$ kubectl apply -f - <<EOF
apiVersion: networking.istio.io/v1beta1
kind: ServiceEntry
metadata:
  name: google
spec:
  hosts:
  - "google.com"
  location: MESH_EXTERNAL
  ports:
  - number: 443
    name: https
    protocol: HTTPS
EOF
Wait a few seconds and see that the traffic can now go through.
root@ubuntu:/# curl https://google.comExit from the pod
root@ubuntu:/# exitDelete it and close the second Cloud Shell tab.
$ kubectl delete pod ubuntuYou can use an Envoy's rate limit service to enable generic rate limit scenarios from different types of applications. Applications request a rate limit decision based on a domain and a set of descriptors. The service reads the configuration from disk via runtime, composes a cache key, and talks to the Redis cache. A decision is then returned to the caller.
The rate limit configuration is in YAML format and includes:
- Domain: A domain is a container for a set of rate limits. All domains known to the Ratelimit service must be globally unique. They serve as a way for different teams/projects to have rate limit configurations that don't conflict.
- Descriptor: A descriptor is a list of key/value pairs owned by a domain that the Ratelimit service uses to select the correct rate limit to use when limiting. Descriptors are case-sensitive.
The rate limit block of a descriptor specifies the actual rate limit that will be used when there is a match. Currently the service supports per second, minute, hour, and day limits.
First, reset the Virtual Service:
$ kubectl apply -f - <<EOF
apiVersion: networking.istio.io/v1beta1
kind: VirtualService
metadata:
  name: guestbook-ui
spec:
  hosts:
  - "*"
  gateways:
  - guestbook-ui-gateway
  http:
  - match:
    - uri:
        prefix: /
    route:
    - destination:
        host: ui
        subset: v1
---
apiVersion: networking.istio.io/v1beta1
kind: DestinationRule
metadata:
  name: ui
spec:
  host: ui
  subsets:
  - name: v1
    labels:
      version: "1.0"
EOF
Let's create a Rate Limit configuration for our Guestbook! For that, will create multiple descriptors. First, our top level descriptor, plan, will differentiate our users by free or premium users. Second, we will have a nested descriptor, account, to apply limits per user.
$ kubectl apply -f - <<EOF
apiVersion: v1
kind: ConfigMap
metadata:
  name: ratelimit-config
data:
  config.yaml: |
    domain: guestbook-ratelimit
    descriptors:
      - key: plan
        value: FREE
        descriptors:
          - key: account
            rate_limit:
              unit: minute
              requests_per_unit: 10
      - key: plan
        value: PREMIUM
        descriptors:
          - key: account
            rate_limit:
              unit: minute
              requests_per_unit: 100
EOF
Next, let's create the Rate Limit Deployment:
$ kubectl apply -f - <<EOF
apiVersion: apps/v1
kind: Deployment
metadata:
  name: ratelimit
spec:
  replicas: 1
  selector:
    matchLabels:
      app: ratelimit
  strategy:
    type: Recreate
  template:
    metadata:
      labels:
        app: ratelimit
    spec:
      containers:
      - image: envoyproxy/ratelimit:v1.4.0
        imagePullPolicy: Always
        name: ratelimit
        command: ["/bin/ratelimit"]
        env:
        - name: LOG_LEVEL
          value: debug
        - name: REDIS_SOCKET_TYPE
          value: tcp
        - name: REDIS_URL
          value: redis:6379
        - name: USE_STATSD
          value: "false"
        - name: RUNTIME_ROOT
          value: /data
        - name: RUNTIME_SUBDIRECTORY
          value: ratelimit
        ports:
        - containerPort: 8080
        - containerPort: 8081
        - containerPort: 6070
        volumeMounts:
        - name: config-volume
          mountPath: /data/ratelimit/config/config.yaml
          subPath: config.yaml
      volumes:
        - name: config-volume
          configMap:
            name: ratelimit-config
EOFAdd the Rate Limit Service:
$ kubectl apply -f - <<EOF
apiVersion: v1
kind: Service
metadata:
  name: ratelimit
  labels:
    app: ratelimit
spec:
  ports:
  - name: "8080"
    port: 8080
    targetPort: 8080
    protocol: TCP
  - name: "8081"
    port: 8081
    targetPort: 8081
    protocol: TCP
  - name: "6070"
    port: 6070
    targetPort: 6070
    protocol: TCP
  selector:
    app: ratelimit
EOF
Check the Rate limiter:
export INGRESS_URL=`kubectl get svc istio-ingressgateway -n istio-system -o=jsonpath={.status.loadBalancer.ingress[0].ip}`

for ((i=1;i<=20;i++));
do curl -I "http://${INGRESS_URL}" --header 'x-plan: FREE' --header 'x-account: user';
done
Using a FREE account we were able to make 20 requests. The rate limiter is configured, but the Envoy fleet doesn't know about that.
To configure the Envoys we need to create an Envoy Filter that will override the default configuration to include our rate limits.
The first filter will configure Envoys to use our Rate Limiter while processing Ingress Gateway requests. It configures the Rate Limiter cluster based on DNS and adds a filter configuration to invoke our gRPC Rate Limit service.
$ kubectl apply -f - <<EOF
apiVersion: networking.istio.io/v1alpha3
kind: EnvoyFilter
metadata:
  name: filter-ratelimit
  namespace: istio-system
spec:
  workloadSelector:
    # select by label in the same namespace
    labels:
      istio: ingressgateway
  configPatches:
    # The Envoy config you want to modify
    - applyTo: HTTP_FILTER
      match:
        context: GATEWAY
        listener:
          filterChain:
            filter:
              name: "envoy.http_connection_manager"
              subFilter:
                name: "envoy.router"
      patch:
        operation: INSERT_BEFORE
        value:
          name: envoy.ratelimit
          typed_config:
            "@type": type.googleapis.com/envoy.config.filter.http.rate_limit.v2.RateLimit
            # domain can be anything! Match it to the ratelimter service config
            domain: guestbook-ratelimit
            failure_mode_deny: true
            rate_limit_service:
              grpc_service:
                envoy_grpc:
                  cluster_name: rate_limit_cluster
                timeout: 10s
    - applyTo: CLUSTER
      match:
        cluster:
          service: ratelimit.default.svc.cluster.local
      patch:
        operation: ADD
        value:
          name: rate_limit_cluster
          type: STRICT_DNS
          connect_timeout: 10s
          lb_policy: ROUND_ROBIN
          http2_protocol_options: {}
          load_assignment:
            cluster_name: rate_limit_cluster
            endpoints:
            - lb_endpoints:
              - endpoint:
                  address:
                    socket_address:
                      address: ratelimit.default.svc.cluster.local
                      port_value: 8081
EOF
The second Envoy Filter will apply the limits for our Virtual Service based on supplied headers:
$ kubectl apply -f - <<EOF
apiVersion: networking.istio.io/v1alpha3
kind: EnvoyFilter
metadata:
  name: filter-ratelimit-svc
  namespace: istio-system
spec:
  workloadSelector:
    labels:
      istio: ingressgateway
  configPatches:
    - applyTo: VIRTUAL_HOST
      match:
        context: GATEWAY
        routeConfiguration:
          vhost:
            name: "*:80" # NOTE: this is an exact match not a glob match. It will not match 'example.com:80'
            route:
              action: ANY
      patch:
        operation: MERGE
        value:
          # rate limit service descriptors config relays on the order of the request headers (desriptor_key)
          rate_limits:
            - actions:
                - request_headers:
                    header_name: "x-plan"
                    descriptor_key: "plan"
                - request_headers:
                    header_name: "x-account"
                    descriptor_key: "account"
EOF
Check the Rate limits again:
export INGRESS_URL=`kubectl get svc istio-ingressgateway -n istio-system -o=jsonpath={.status.loadBalancer.ingress[0].ip}`

for ((i=1;i<=20;i++));
do curl -I "http://${INGRESS_URL}" --header 'x-plan: FREE' --header 'x-account: user';
done
Using a FREE account we were able to make 10 requests after which you should get "429 Too Many Requests", as we have a 10 per minute requests limit configured.
Try again with premium plan:
for ((i=1;i<=90;i++));
do curl -I "http://${INGRESS_URL}" --header 'x-plan: PREMIUM' --header 'x-account: user';
done
You should be able to make 90 requests, as the limit is 100 per minute.
Clean up the limits:
$ kubectl delete svc ratelimit
$ kubectl delete deployment ratelimit
$ kubectl delete envoyfilter -n istio-system filter-ratelimit
$ kubectl delete envoyfilter -n istio-system filter-ratelimit-svcMonitoring
We installed Grafana & Prometheus addon in our Operator config. Open the Grafana dashboard:
$ istioctl dashboard grafana --port 8080In Cloud Shell, click Web Preview icon → Preview on port 8080.
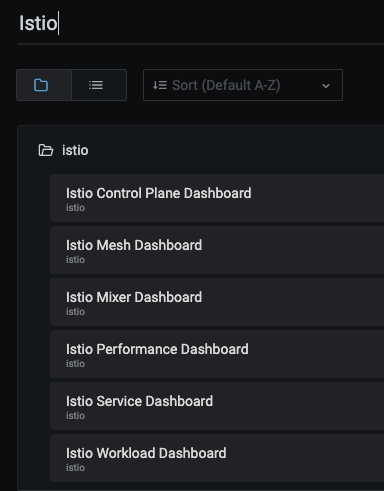
In the Grafana Dashboard, click Search.

In "Search dashboard by name" field enter: Istio.
Then select Istio Service Dashboard.
In Service, find and click ui.default.svc.cluster.local.
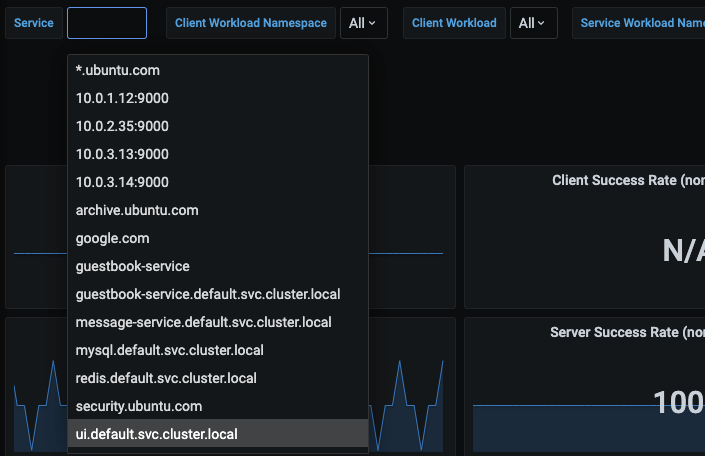
This will pull up the metrics specific to the UI service.
Make a few requests to the UI from your browser, and you should also see the Istio Dashboard update with the metrics.
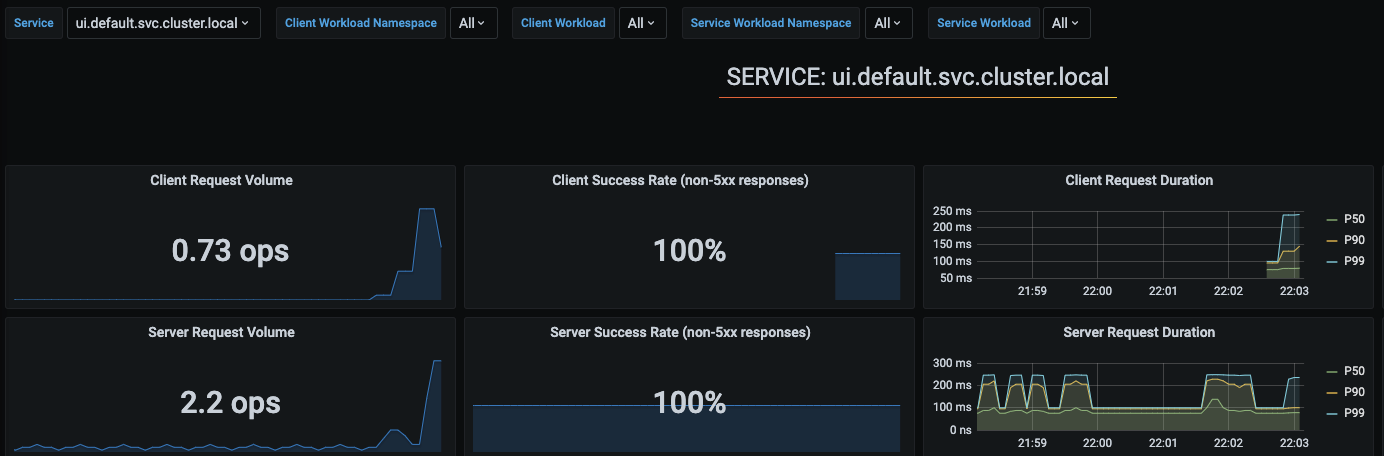
The metrics are actually coming from Prometheus. Behind the scenes, Prometheus agent is scraping metrics from Envoy proxy, which has all the monitoring metrics such as latency, response status distributions, etc.
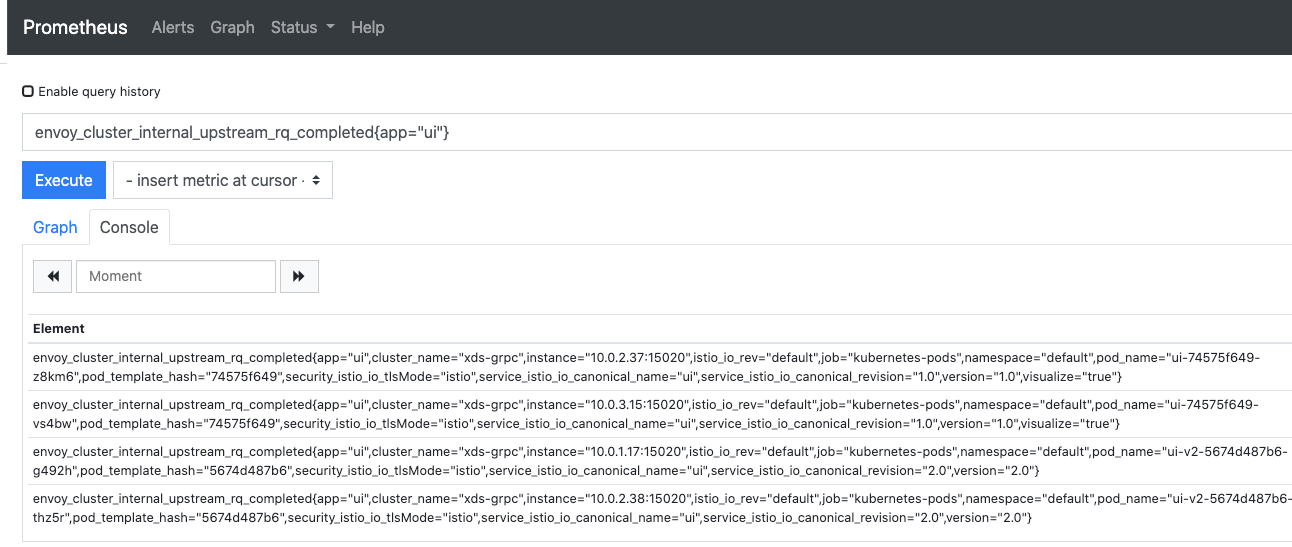
In the Cloud Shell, stop the current tunnel and establish a tunnel to Prometheus instead.
$ istioctl dashboard prometheus --port 8080Use Cloud Shell web preview to preview port 8080. This will take you to the Prometheus console. Query a metric, e.g., envoy_cluster_internal_upstream_rq_completed{app="ui"}
But how are these metrics acquired? Let's take a look at the proxy in more detail. Find a pod to investigate:
$ kubectl get pods -l app=uiPick one of the pods and port forward to Envoy.
$ kubectl port-forward ui-v1-..... 8080:15000Use Cloud Shell web preview to preview port 8080. This will take you to this Envoy instance's Admin console.
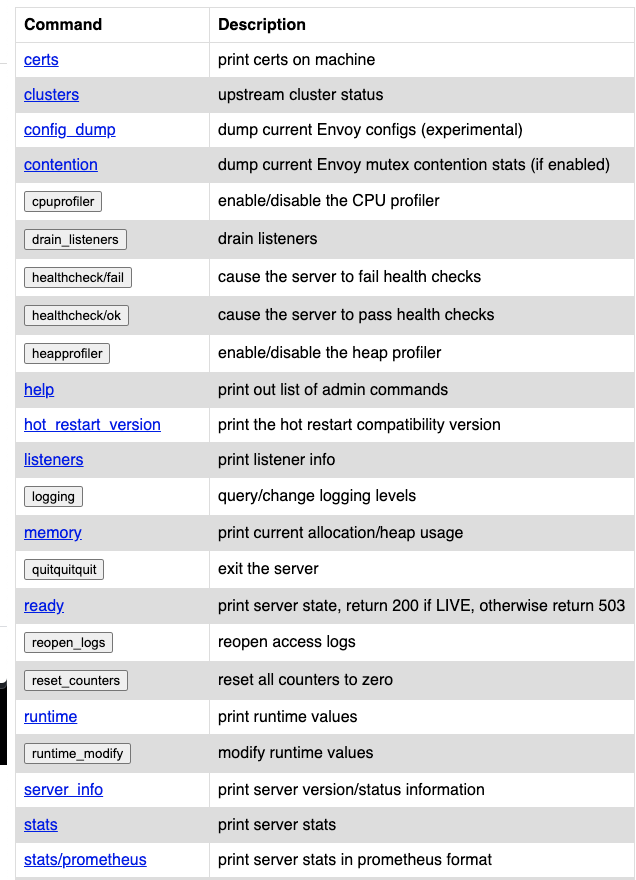
Click stats/prometheus to see the exported Prometheus metrics.
When you're done - stop the port-forward.
Observability
Establish a tunnel to Kiali.
$ istioctl dashboard kiali --port 8080Use Cloud Shell web preview to preview port 8080.
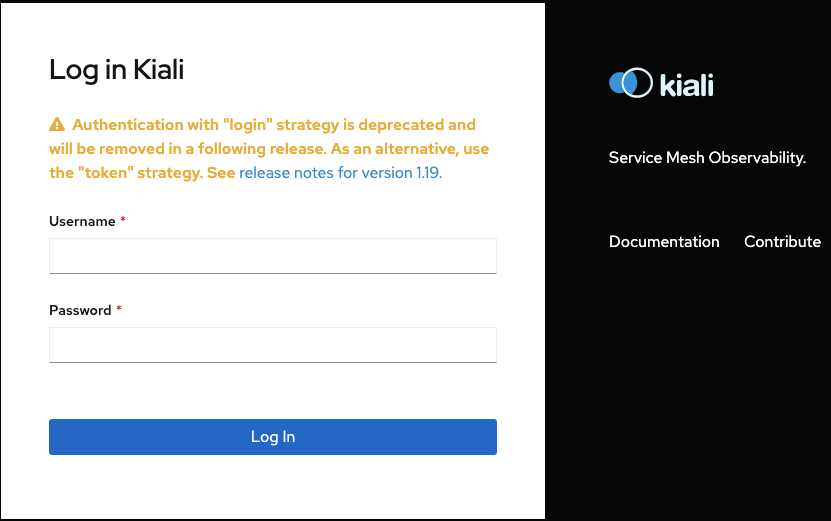
Login with username admin and password admin.
Click Graph, and select the default Namespace.
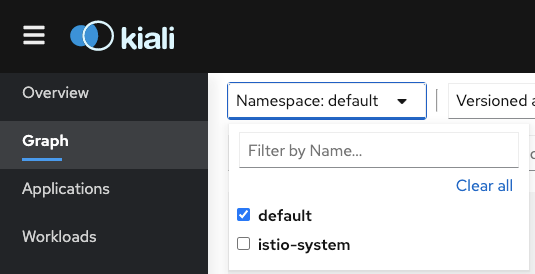
This will bring up the service graph that shows service to service connections.
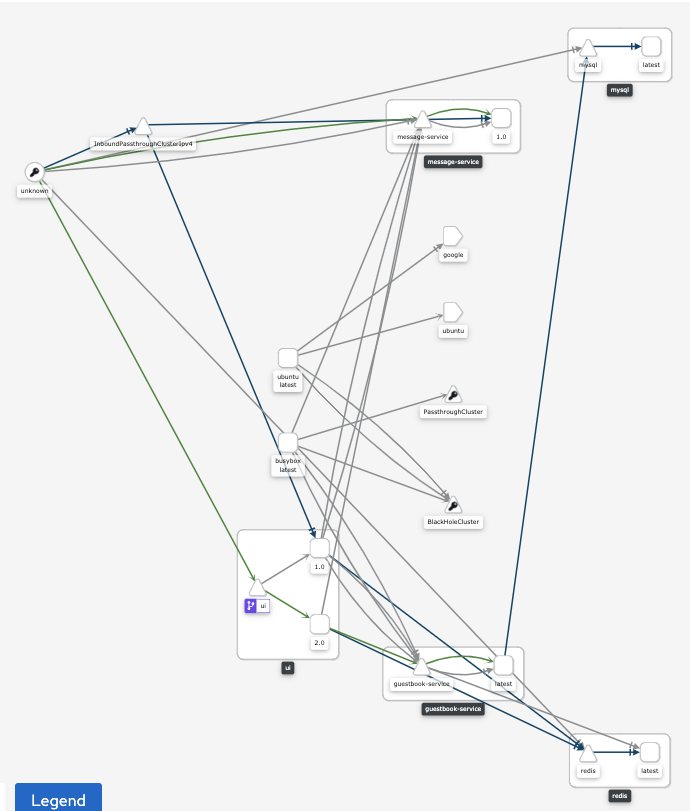
Explore the Kiali console and move to the next step when you are ready.
To see traces for requests, establish a tunnel to Zipkin.
$ istioctl dashboard zipkin --port 8080Use Cloud Shell web preview to preview port 8080 to see the Zipkin console.
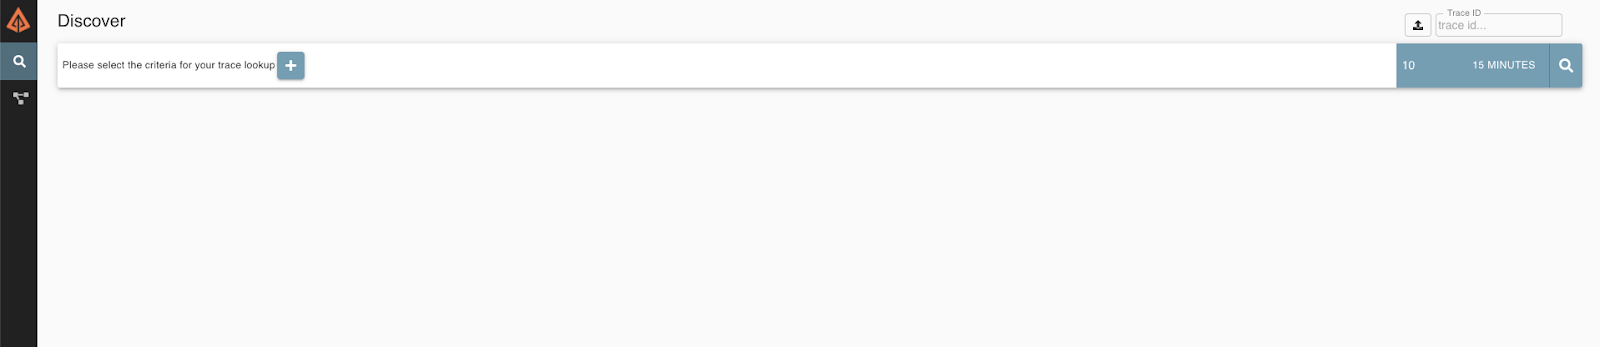
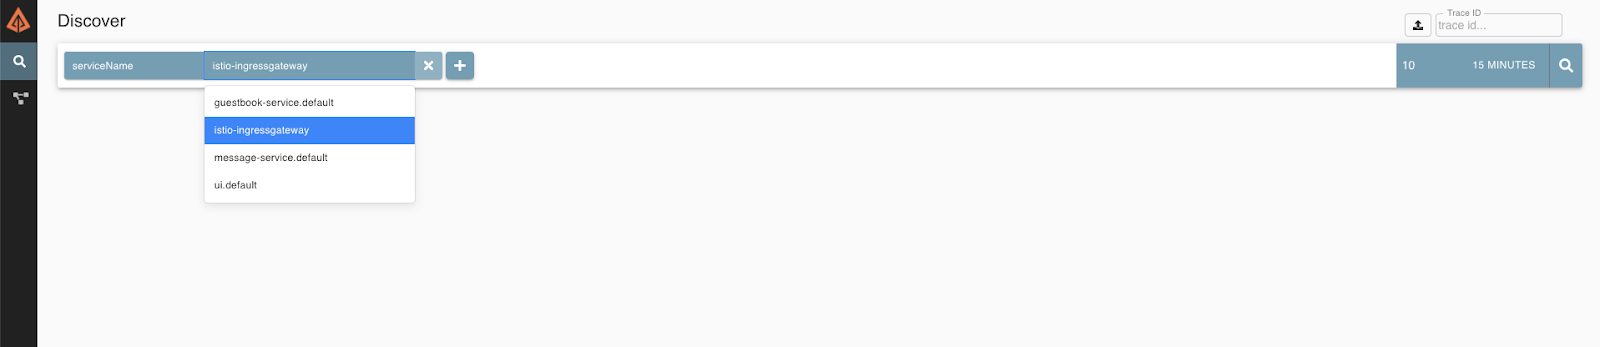
In Discover click + and enter ServiceName→ istio-ingressgateway. And click the search button to the right. This will show you all the requests that came through the Istio Ingress.
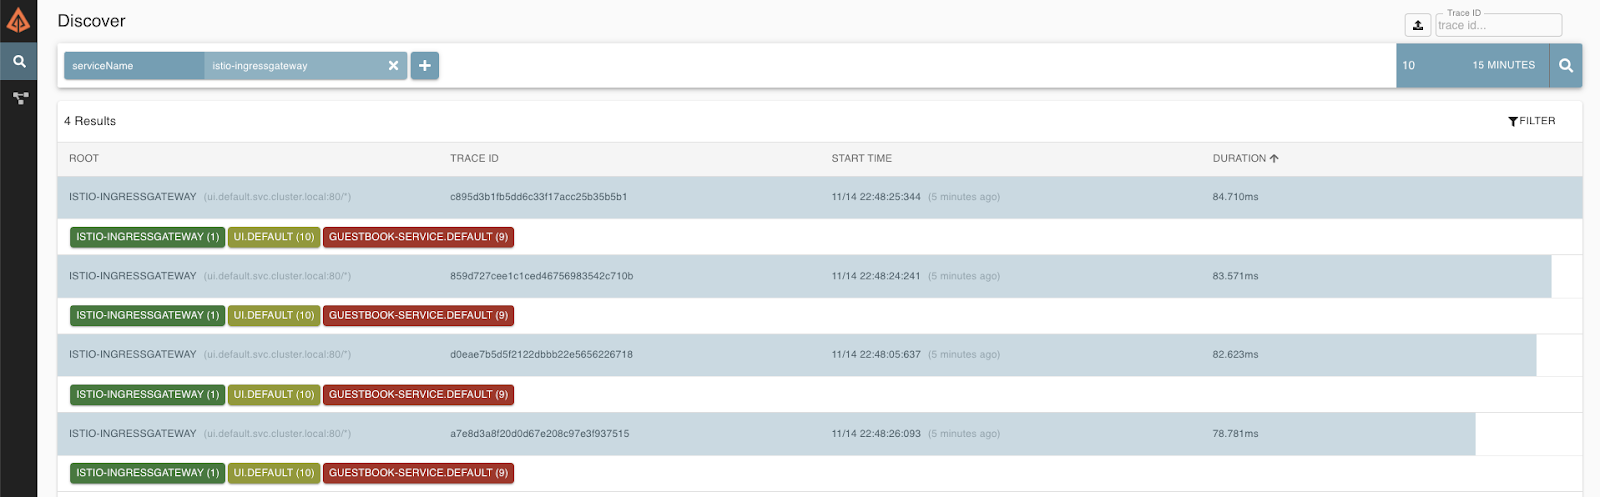
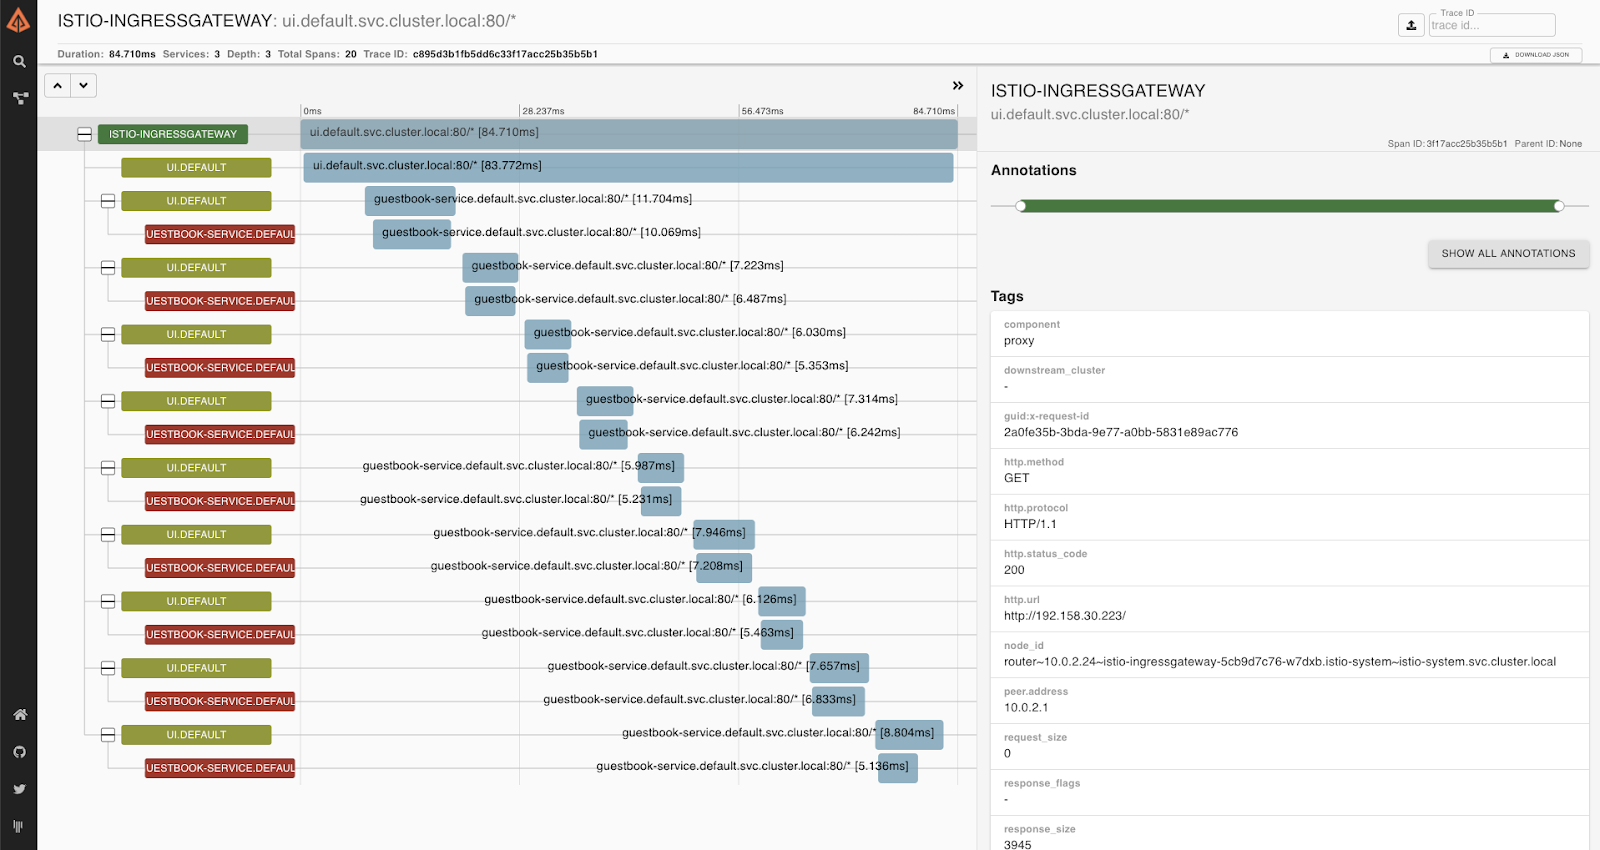
Click into one of the traces to see more information.
Congratulations! You went through the basics of Istio. Let's add Mutual TLS and relevant capabilities to your deployment. But wait, we already have mTLS enabled by default, but in permissive mode, where services are allowed to communicate with each other by plain text.
Now let's enforce it! Enable mTLS in the default namespace.
$ kubectl apply -n default -f - <<EOF
apiVersion: "security.istio.io/v1beta1"
kind: "PeerAuthentication"
metadata:
  name: "default"
spec:
  mtls:
    mode: STRICT
EOF
Configure Destination Policy.
$ kubectl apply -f - <<EOF
apiVersion: "networking.istio.io/v1beta1"
kind: "DestinationRule"
metadata:
  name: "default"
  namespace: "default"
spec:
  host: "*.default.svc.cluster.local"
  trafficPolicy:
    tls:
      mode: ISTIO_MUTUAL
EOF
Generally, health check requests to the liveness-http service are sent by Kubelet, which does not have an Istio issued certificate. Therefore when mutual TLS is enabled, the health check requests should fail.
Istio solves this problem by rewriting the application PodSpec readiness/liveness probe, so that the probe request is sent to the sidecar agent. The sidecar agent then redirects the request to the application, strips the response body, only returning the response code.
This feature is enabled by default in all built-in Istio configuration profiles. Let's try disabling it for our UI v2 deployment to see what will happen.
Create UI v2 deployment:
$ cd ~/gcp-k8s-lab/kubernetes
$ cat <<EOF >> ui-deployment-v2-rewrite.yaml
apiVersion: apps/v1
kind: Deployment
metadata:
  name: ui-v2
  labels:
    app: ui
    version: "2.0"
spec:
  replicas: 1
  selector:
    matchLabels:
      app: ui
      version: "2.0"
  template:
    metadata:
      labels:
        app: ui
        version: "2.0"
      annotations:
        sidecar.istio.io/rewriteAppHTTPProbers: "false"
    spec:
      serviceAccountName: ui-sa
      containers:
      - name: ui
        image: gcr.io/${GOOGLE_CLOUD_PROJECT}/ui:v2
        env:
          - name: MESSAGE_HOST
            value: http://message-service
          - name: GUESTBOOK_HOST
            value: http://guestbook-service
          - name: REDIS_HOST
            value: redis
        readinessProbe:
          initialDelaySeconds: 40
          httpGet:
            path: /
            port: 8080
        ports:
        - name: http
          containerPort: 8080
        - name: metrics
          containerPort: 9000
EOF
Install UI v2.
$ kubectl apply -f ui-deployment-v2-rewrite.yamlWait for about 60-70 seconds for v2 pods to start. You'll notice that it is failing a health check:
$ watch kubectl get pods -lapp=ui,version="2.0"

NAME                                 READY   STATUS    RESTARTS   AGE
...
ui-v2-699c5b46b6-df9wg               1/2     Running   0          2m23s
If, for some reason, you don't want to enable health check rewrites, there are a number of solutions to this:
- Set mTLS to Permissive mode, so that Istio allows both mTLS and non-TLS connections.
- Use a local (inside the application container) health checker program, e.g.
wget,curl, or your own executable, to check against the port. - Expose health check endpoints on a different port that doesn't require mTLS.
- Configure liveness probes using the TCP socket
For delete the V2 deployment.
$ kubectl delete deployment ui-v2Validating mTLS Connection
Create a new Namespace that doesn't have Istio automatic sidecar injection.
$ kubectl create ns noistioRun an Ubuntu Pod in the noistio namespace.
$ kubectl -n noistio run -i --tty ubuntu --image=ubuntu -- bashConnect to Message Service from the pod that doesn't have Istio mTLS.
root@ubuntu:/# apt update && apt install curl -y
root@ubuntu:/# curl http://message-service.default.svc.cluster.local/hello/test

curl: (56) Recv failure: Connection reset by peer
Exit and delete this pod:
$ root@ubuntu:/# exit
$ kubectl -n noistio delete pod ubuntu
Execute curl from the Ubuntu pod in the default namespace that has Istio enabled.
$ kubectl -n default run -i --tty ubuntu --image=ubuntu -- bash
root@ubuntu:/# apt update && apt install curl -y
root@ubuntu:/# curl http://message-service.default.svc.cluster.local/hello/test

{"greeting":"Hello test from message-service-545c84c666-nqfx6 with 1.0","version":"1.0","hostname":"message-service-545c84c666-nqfx6"}

root@ubuntu:/# exit
It works in default namespace because the Istio proxy is automatically configured with the certificates.
$ kubectl exec -ti ubuntu -c istio-proxy -- openssl s_client -showcerts -connect message-service.default:80

CONNECTED(00000005)
depth=1 O = cluster.local
verify error:num=19:self signed certificate in certificate chain
---
Certificate chain
 0 s:
   i:O = cluster.local
...
Let's examine these certificates!
$ mkdir certs
$ cd certs
$ kubectl exec -ti ubuntu -c istio-proxy -- openssl s_client -showcerts -connect message-service.default:80 > message-cert.txt
$ sed -n '/-----BEGIN CERTIFICATE-----/{:start /-----END CERTIFICATE-----/!{N;b start};/.*/p}' message-cert.txt > certs.pem
$ awk 'BEGIN {counter=0;} /BEGIN CERT/{counter++} { print > "proxy-cert-" counter ".pem"}' < certs.pemTake a look at the certificate in more detail.
$ openssl x509 -in proxy-cert-1.pem -text

Certificate:
    Data:
        Version: 3 (0x2)
        Serial Number:
            22:7c:a8:c9:24:f3:7c:9c:ea:a9:54:53:da:e1:e7:1f
        Signature Algorithm: sha256WithRSAEncryption
        Issuer: O = cluster.local
        ...
        Subject:
        Subject Public Key Info:
                ...
                Exponent: 65537 (0x10001)
        X509v3 extensions:
            X509v3 Key Usage: critical
                Digital Signature, Key Encipherment
            X509v3 Extended Key Usage:
                TLS Web Server Authentication, TLS Web Client Authentication
            X509v3 Basic Constraints: critical
                CA:FALSE
            X509v3 Subject Alternative Name: critical
                URI:spiffe://cluster.local/ns/default/sa/message-sa
...
Notice the Subject Alternative Name. This name is tied to the service account associated with the pod (that we assigned in the deployment file).
Delete the Ubuntu pod.
$ kubectl -n default delete pod ubuntuIstio RBAC Authorization policies
Using Istio, you can easily set up access control for workloads in your mesh. First, you should configure a simple deny-all policy that rejects all requests to the workload, and then grant more access to the workload gradually and incrementally.
$ kubectl apply -f - <<EOF
apiVersion: security.istio.io/v1beta1
kind: AuthorizationPolicy
metadata:
  name: deny-all
  namespace: default
spec:
  {}
EOF
Point your browser at the UI. You should see an "no healthy upstream" error, indicating that something happened to the pods. This is because the UI can't connect to Redis. Let's fix it before moving forward. Run the following command to create the redis-tcp-policy to allow the UI service, which issues requests using the cluster.local/ns/default/sa/ui-sa service account, to access the Redis using TCP connection. We'll review what's going on next.
$ kubectl apply -f - <<EOF
apiVersion: security.istio.io/v1beta1
kind: AuthorizationPolicy
metadata:
  name: redis-tcp-policy
  namespace: default
spec:
  selector:
    matchLabels:
      app: redis
  action: ALLOW
  rules:
  - from:
    - source:
        principals: ["cluster.local/ns/default/sa/ui-sa"]
  - to:
    - operation:
       ports: ["6379"]
EOF
Wait 10-20 seconds and refresh the UI. You should see an "RBAC: access denied" error, that shows that the configured deny-all policy is working as intended, and Istio doesn't have any rules that allow any access to workloads in the mesh.
Run the following command to create a ui-viewer policy to allow access with GET and POST methods to the UI service. The policy does not set the from field in the rules which means all sources are allowed, effectively allowing all users and service:
$ kubectl apply -f - <<EOF
apiVersion: "security.istio.io/v1beta1"
kind: "AuthorizationPolicy"
metadata:
  name: "ui-viewer"
  namespace: default
spec:
  selector:
    matchLabels:
      app: ui
  rules:
  - to:
    - operation:
        methods: ["GET", "POST"]
EOF
Refresh your UI and see that the UI is working, but you get "Guestbook Service is currently unavailable" message.
We have created service accounts for different services. For example, for UI we have following service account in ui-deployment.yaml:
apiVersion: v1
kind: ServiceAccount
metadata:
  name: ui-sa
  labels:
    account: ui
And it is connected to the pod:
apiVersion: apps/v1
kind: Deployment
metadata:
  name: ui
  ...
spec:
  ...
  template:
    ...
    spec:
      serviceAccountName: ui-sa
      containers:
      - name: ui
        image: gcr.io/PROJECT_ID_GCP/ui:v1
...
We can use it to authorize services in the mesh. First, run the following command to create the mysql-tcp-policy to allow the Guestbook service, which issues requests using the cluster.local/ns/default/sa/guestbook-sa service account, to access the MySQL using TCP connection.
$ kubectl apply -f - <<EOF
apiVersion: security.istio.io/v1beta1
kind: AuthorizationPolicy
metadata:
  name: mysql-tcp-policy
  namespace: default
spec:
  selector:
    matchLabels:
      app: mysql
  action: ALLOW
  rules:
  - from:
    - source:
        principals: ["cluster.local/ns/default/sa/guestbook-sa"]
  - to:
    - operation:
       ports: ["3306"]
EOF
Run the following command to create the guestbook-viewer policy to allow the UI service, which issues requests using the cluster.local/ns/default/sa/ui-sa service account, to access the Guestbook service through GET and POST methods.
$ kubectl apply -f - <<EOF
apiVersion: "security.istio.io/v1beta1"
kind: "AuthorizationPolicy"
metadata:
  name: "guestbook-viewer"
  namespace: default
spec:
  selector:
    matchLabels:
      app: guestbook-service
  rules:
  - from:
    - source:
        principals: ["cluster.local/ns/default/sa/ui-sa"]
    to:
    - operation:
        methods: ["GET", "POST"]
EOF
Finally, run the following command to create the message-viewer policy to allow the UI service, which issues requests using the cluster.local/ns/default/sa/ui-sa service account, to access the Message service through GET methods.
$ kubectl apply -f - <<EOF
apiVersion: "security.istio.io/v1beta1"
kind: "AuthorizationPolicy"
metadata:
  name: "message-viewer"
  namespace: default
spec:
  selector:
    matchLabels:
      app: message-service
  rules:
  - from:
    - source:
        principals: ["cluster.local/ns/default/sa/ui-sa"]
    to:
    - operation:
        methods: ["GET"]
EOF
JWT Authorization
Let's see how to set up an Istio authorization policy to enforce access based on a JSON Web Token (JWT). An Istio authorization policy supports both string typed and list-of-string typed JWT claims.
First, we need to create a Request Authentication policy to tell Istio which JWT token issuer is supported:
$ kubectl apply -f - <<EOF
apiVersion: "security.istio.io/v1beta1"
kind: "RequestAuthentication"
metadata:
  name: "ui-jwt-auth"
  namespace: default
spec:
  selector:
    matchLabels:
      app: ui
  jwtRules:
  - issuer: "testing@secure.istio.io"
    jwksUri: "https://raw.githubusercontent.com/istio/istio/release-1.7/security/tools/jwt/samples/jwks.json"
EOFLet's try sending a request from a Curl pod with an invalid JWT.
$ kubectl run curl --image=curlimages/curl --restart=Never --command sleep infinity
$ kubectl exec -ti curl -c curl -- curl http://ui.default.svc.cluster.local -s -o /dev/null -H "Authorization: Bearer invalidToken" -w "%{http_code}\n"

401
Now we need to enforce the authentication. The following command creates the ui-viewer authorization policy for the UI service. The policy requires all requests to have a valid JWT with requestPrincipal set to testing@secure.istio.io/testing@secure.istio.io. Istio constructs the requestPrincipal by combining the iss and sub of the JWT token with a / separator.
$ kubectl apply -f - <<EOF
apiVersion: security.istio.io/v1beta1
kind: AuthorizationPolicy
metadata:
  name: ui-viewer
  namespace: default
spec:
  selector:
    matchLabels:
      app: ui
  action: ALLOW
  rules:
  - from:
    - source:
       requestPrincipals: ["testing@secure.istio.io/testing@secure.istio.io"]
EOFNext, get the JWT that sets the iss and sub keys to the same value, testing@secure.istio.io. This causes Istio to generate the attribute requestPrincipal with the value testing@secure.istio.io/testing@secure.istio.io:
$ TOKEN=$(curl https://raw.githubusercontent.com/istio/istio/release-1.7/security/tools/jwt/samples/demo.jwt -s) && echo "$TOKEN" | cut -d '.' -f2 - | base64 --decode -

{"exp":4685989700,"foo":"bar","iat":1532389700,"iss":"testing@secure.istio.io","sub":"testing@secure.istio.io"}
Verify that a request with a valid JWT is allowed:
$ kubectl exec -ti curl -c curl -- curl http://ui.default.svc.cluster.local -s -o /dev/null -H "Authorization: Bearer $TOKEN" -w "%{http_code}\n"

200
To delete the image from registry enter the following.
$ gcloud container images list --format="json" | \
  jq .[].name | xargs -I {} gcloud container images delete \
  --force-delete-tags --quiet {}
In the Management Console, from the Products and Services menu, go to the Container Registry service. You should see your image is gone.
Next, delete the cluster
$ gcloud container clusters delete devops-cluster --zone europe-west1-bFinally, check if there are any persistent disks left and delete them:
$ gcloud compute disks list --format="json" | jq .[].name | \
  grep "devops-cluster" | xargs gcloud compute disks delete --zone europe-west1-b
Thank you! :)