Last Updated: 2022-11-14
Kubernetes
Kubernetes is an open source project (available on kubernetes.io) which can run on many different environments, from laptops to high-availability multi-node clusters, from public clouds to on-premise deployments, from virtual machines to bare metal.
For the purpose of this codelab, using an environment set up in GKE will allow you to focus more on experiencing Kubernetes rather than setting up the underlying infrastructure but you can choose any other managed solution or environment (i.e. local MicroK8s, k3s, Kops) instead.
What you'll build
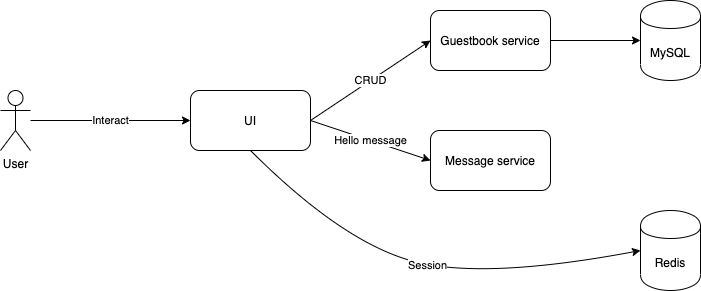
In this codelab, you're going to deploy a guestbook microservice app using Kubernetes. Your app will:
- Consist of 3 services
- Use Redis to cache sessions.
- Use MySQL for persistence.
What you'll need
- A recent version of your favorite Web Browser
- Basics of BASH
- GCP Account
Create an Account
In this step, you register for the Google Cloud Platform free trial and create a project. The free trial provides you:
- $300 Credit for Free
- Access to Google Cloud Platform Products
- You Won't be Billed (though you need to enter your credit card)
- Build with the Power, Speed, Security, Reliability, and Scalability of Google
To register for the free trial open the free trial Registration page.
If you do not have a Gmail account, follow the steps to create one. Otherwise, login and complete the registration form.
Read and agree to the terms of service. Click Accept and start a free trial.
Create a Project
Next, create your first project using the Google Cloud Platform Console. The project is used to complete the rest of the lab.
To create a project in the Google Cloud Platform Console, click Select a project > Create a project.
In the New Project dialog: for Project name, type whatever you like. Make a note of the Project ID in the text below the project name box; you need it later. Then click Create.
Upgrade Account (Optional)
In the upper-right corner of the console, a button will appear asking you to upgrade your account. Click Create a Project when you see it. If the Upgrade button does not appear, you may skip this step. If the button appears later, click it when it does.
When you upgrade your account, you immediately have access to standard service quotas, which are higher than those available on the free trial.
Finalize
On the GCP Console, use the left-hand side menu to navigate to Compute Engine and ensure that there are no errors.
At the end of this lab, you may delete this project and close your billing account if desired.
Before you can use Kubernetes to deploy your application, you need a cluster of machines to deploy them to. The cluster abstracts the details of the underlying machines you deploy to the cluster.
Machines can later be added, removed, or rebooted and containers are automatically distributed or re-distributed across whatever machines are available in the cluster. Machines within a cluster can be set to autoscale up or down to meet demand. Machines can be located in different zones for high availability.
Open CloudShell
You will do most of the work from the Google Cloud Shell, a command line environment running in the Cloud. This virtual machine is loaded with all the development tools you'll need (docker, gcloud, kubectl and others) and offers a persistent 5GB home directory and runs in Google Cloud, greatly enhancing network performance and authentication. Open the Google Cloud Shell by clicking on the icon on the top right of the screen:

You should see the shell prompt at the bottom of the window:
Once connected to Cloud Shell, you should see that you are already authenticated and that the project is already set to your project ID.
Run the following command in Cloud Shell to confirm that you are authenticated
gcloud auth listIf it's the first time you are running Cloud Shell - authorize it.
You might need to run the command again after authorization. Command output:
 Credentialed Accounts
ACTIVE  ACCOUNT
*       <my_account>@<my_domain.com>

To set the active account, run:
$ gcloud config set account `ACCOUNT`Check if your project is set correctly.
gcloud config list projectCommand output
[core]
project = <PROJECT_ID>
If it is not, you can set it with this command:
gcloud config set project <PROJECT_ID>Create a Cluster
Type the following to find a suitable instance type in europe-west1-b zone (as we will need 2 CPUs and 4 GB memory later):
$ gcloud compute machine-types list --filter="zone:( europe-west1-b )" | awk '$4 ~ /^4.00/ || FNR == 1 { print }'It should be e2-medium.
Now, enter the following command to create a cluster of machines.
$ export PROJECT_ID=$(gcloud config get-value project)
$ gcloud container clusters create devops-cluster --zone "europe-west1-b" \
--num-nodes 4 --machine-type=e2-medium \
--project=${PROJECT_ID} --enable-ip-alias \
--scopes=gke-default,cloud-platformWhen the cluster is ready, refresh the Kubernetes Engine page in the management console and you should see it.
A node is really just a virtual machine. From the Products and Services menu, choose Compute Engine and you should see your machines.
Initial setup
In the real world you may, for example, want to deploy your application with 1 replica in the Dev environment, 2 replicas in staging, and 10 replicas in Production. Rather than setting those as variables and using a homegrown templating engine, you can use Kustomize to edit these attributes. Kustomize allows you to quickly re-use and edit existing Kubernetes manifests for different target environments.
$ curl -s "https://raw.githubusercontent.com/\
kubernetes-sigs/kustomize/master/hack/install_kustomize.sh"  | bash
$ sudo mv kustomize /usr/local/bin/kustomize
Get the application sources
Start by cloning the repository for our Guestbook application.
$ cd ~/
$ git clone https://gitlab.com/DmyMi/gcp-k8s-labBuild images and push to GCR
Move into the project directory.
$ cd ~/gcp-k8s-lab/Configure access to GCR from your Cloud Shell by using the gcloud credential helper:
$ gcloud auth configure-dockerBuild the initial versions of images:
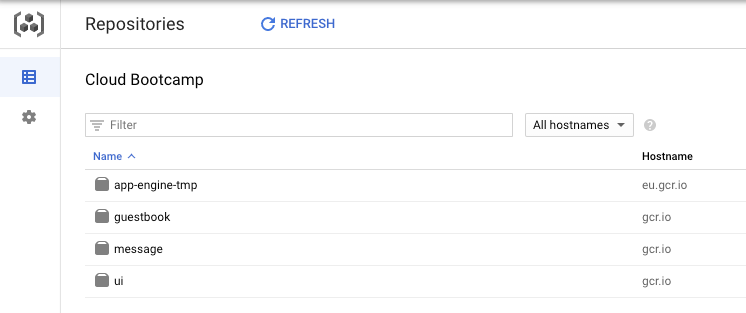
$ ./gradlew jibWhen the command finishes, open a new browser tab and navigate to the Google Cloud Platform console. Navigate to Tools → Container Registry → Images.
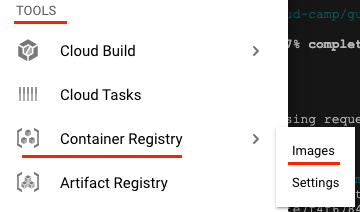
You should see 3 application repositories (ui, message, guestbook) among others in your GCR.
Example directory
Move into the kubernetes examples directory.
$ cd ~/gcp-k8s-lab/kubernetes/You will be using the yaml files in this directory. Every file describes a resource that needs to be deployed into Kubernetes.
To edit the repository names - execute the following script:
for name in "guestbook-deployment" "message-deployment" "ui-deployment"
do
  /bin/sed "s/PROJECT_ID_GCP/${GOOGLE_CLOUD_PROJECT}/g" "${name}".yaml.tpl > "${name}".yaml
done
Redis deployment
A Kubernetes pod is a group of containers, tied together for the purposes of administration and networking. It can contain one or more containers. All containers within a single pod will share the same networking interface, IP address, volumes, etc. All containers within the same pod instance will live and die together. It's especially useful when you have, for example, a container that runs the application, and another container that periodically polls logs/metrics from the application container.
You can start a single Pod in Kubernetes by creating a Pod resource. However, a Pod created this way would be known as a Naked Pod. If a Naked Pod dies/exits, it will not be restarted by Kubernetes. A better way to start a pod is by using a higher-level construct such as a Deployment.
Deployment provides declarative updates for Pods and Replica Sets. You only need to describe the desired state in a Deployment object, and the Deployment controller will change the actual state to the desired state at a controlled rate for you. It does this using an object called a ReplicaSet under the covers. You can use deployments to easily:
- Create a Deployment to bring up a ReplicaSet and Pods.
- Check the status of a Deployment to see if it succeeds or not.
- Later, update that Deployment to recreate the Pods (for example, to use a new image, or configuration).
- Rollback to an earlier Deployment revision if the current Deployment isn't stable.
- Pause and resume a Deployment.
Open the redis-deployment.yaml to examine the deployment descriptor. You can use your favorite editor such as Cloud Shell Editor, vi, emacs, or nano.
First create a Pod using kubectl, the Kubernetes CLI tool:
$ kubectl apply -f redis-deployment.yamlYou should see a Redis instance running
$ kubectl get podsNote down the Pod name, you can kill this Redis instance
$ export REDIS_POD=$(kubectl get pods -l app=redis -o jsonpath='{.items[0].metadata.name}')
$ kubectl delete pod $REDIS_POD
Kubernetes will automatically restart this pod for you (lets see some additional info):
$ kubectl get pods -owideYou can also launch a command or start a shell directly within the container using kubectl exec command. Let's get the new pod name and open a shell inside of the Redis container:
$ export REDIS_POD=$(kubectl get pods -l app=redis -o jsonpath='{.items[0].metadata.name}')
$ kubectl exec -ti $REDIS_POD -- /bin/bash
root@redis...:/data# ls /
bin  boot  data  dev  etc  home ...
The Pod name is automatically assigned as the hostname of the container. Each Pod is also automatically assigned an ephemeral internal IP address:
root@redis...:/data# hostname
redis-....
root@redis...:/data# hostname -i
10.x.x.x
root@redis...:/data# exitLastly, any of the container output to STDOUT and STDERR will be accessible as Kubernetes logs:
$ kubectl logs $REDIS_PODYou can also see the logs in realtime:
$ kubectl logs --follow $REDIS_PODPress Ctrl + C to exit.
Redis Service
Each Pod has a unique IP address - but the address is ephemeral. The Pod IP addresses are not stable and it can change when Pods start and/or restart. A service provides a single access point to a set of pods matching some constraints. A Service IP address is stable.
Open the redis-service.yaml to examine the service descriptor. The important part about this file is the selector section. This is how a service knows which pod to route the traffic to, by matching the selector labels with the labels of the pods:
kind: Service
apiVersion: v1
metadata:
  name: redis
  labels:
    app: redis
spec:
  ports:
    - port: 6379
      targetPort: 6379
      protocol: TCP
  selector:
app: redisCreate the Redis service:
$ kubectl apply -f redis-service.yaml --recordAnd check it:
$ kubectl get svc
NAME         CLUSTER-IP  EXTERNAL-IP   PORT(S)    AGE
kubernetes   10.x.x.x    <none>        443/TCP    10m
redis        10.x.x.x    <none>        6379/TCP   30s
MySQL StatefulSet and Service
MySQL uses persistent storage. Rather than writing the data directly into the container image itself, our example stores the MySQL in a Persistent Disk volume.
Also, our database instance is stateful (i.e., stores instance-specific data), we'll run into issues quickly if we use a normal Kubernetes Deployment, because each of the replicas will be pointing to exactly the same persistent volume for storage - and it may not work.
Not only that, but if we set up replication then each Pod will have an ephemeral Pod name, making it impossible to tell which Pod is the primary/master/first.
With StatefulSet, each Pod can have its own persistent volumes - and the names become stable, i.e., the first instance of the StatefulSet will have the ID of 0, and the second instance will have ID of 1.
We can deploy MySQL as a StatefulSet:
$ kubectl apply -f mysql-stateful.yaml --recordIn this YAML file, notice of a couple of important details:
- The kind is a StatefulSet rather than a Deployment or ReplicaSet
- If you increase replica count - you can depend on
mysql-0being provisioned beforemysql-1. Provision of the instances is sequential, from the first instance to the number of replicas you need. volumeClaimTemplatesis used to automatically generate a new Persistent Volume Claim, and subsequently, this will automatically provision a disk in GCP with the specified capacity. We don't need to create a Persistent Disk manually.
Open the mysql-stateful.yaml to examine the service descriptor. The important part about this file is the volumeClaimTemplates and volumeMounts section. This section describes that the Pod needs to use a Persistent Disk volume that will be created automatically, and also mounting that disk into a path specific to the MySQL container.
apiVersion: apps/v1
kind: StatefulSet
metadata:
  name: mysql
  labels:
    app: mysql
spec:
  serviceName: "mysql"
  replicas: 1
  selector:
    matchLabels:
      app: mysql
  template:
    metadata:
      labels:
        app: mysql
    spec:
      containers:
      - name: mysql
        ...
        volumeMounts:
          # name must match the volume name below
        - name: mysql-persistent-storage
          # mount path within the container
          mountPath: /var/lib/mysql
  volumeClaimTemplates:
    - metadata:
        name: mysql-persistent-storage
      spec:
        accessModes: [ "ReadWriteOnce" ]
        storageClassName: "standard"
        resources:
          requests:
storage: 5GiNow you can deploy the Service:
$ kubectl apply -f mysql-service.yaml --recordLastly, you can see the Pods and service status via the command line. Recall the command you can use to see the status (hint: kubectl get ...). Make sure the status is Running before continuing.
We have two separate services to deploy:
- the Guestbook service (that writes to the MySQL database)
- a Message service
Both services are containers whose images contain compiled Java class files. The source is available in the respective directories if you are interested in seeing it.
When deploying these microservices instances, we want to make sure that:
- We can scale the number of instances once deployed.
- If any of the instances becomes unhealthy and/or fails, we want to make sure they are restarted automatically.
- If any of the machines that run the service is down (scheduled or unscheduled), we need to reschedule the microservice instances to another machine.
Create a new base directory for our kustomizations and move files there:
$ mkdir -p ~/gcp-k8s-lab/kubernetes/base
$ cd ~/gcp-k8s-lab/kubernetes/
$ cp {guestbook-deployment.yaml,guestbook-service.yaml,message-deployment.yaml,message-service.yaml,ui-deployment.yaml,ui-service.yaml} ./base
Create a kustomization.yaml:
$ cd ~/gcp-k8s-lab/kubernetes/base
$ kustomize create
$ kustomize edit add resource {guestbook-deployment.yaml,guestbook-service.yaml,message-deployment.yaml,message-service.yaml}
This will create a kustomization.yaml with the 4 YAMLs as the base manifests. Verify that resources are added:
$ cat kustomization.yaml

apiVersion: kustomize.config.k8s.io/v1beta1
kind: Kustomization
resources:
- guestbook-deployment.yaml
- guestbook-service.yaml
- message-deployment.yaml
- message-service.yaml
Use Kustomize to combine the 4 manifests into a single deployable manifest.
$ kustomize buildYou can also apply it directly to Kubernetes:
$ kustomize build | kubectl apply -f -Once created, you can see the replicas with:
$ kubectl get deployment
NAME                READY   UP-TO-DATE   AVAILABLE   AGE
guestbook-service   2/2     2            2           33s
message-service     2/2     2            2           33s
redis               1/1     1            1           19m
The Deployment, behind the scenes, creates a Replica Set. A Replica Set ensures the number of replicas (instances) you need to run at any given time. You can also see the Replica Set:
$ kubectl get rsNotice that because we also used Deployment to deploy Redis - each of those deployments created its own Replica Set as well. Our descriptor file specified 2 replicas. So, if you delete one of the pods (and now you only have 1 replica rather than 2), the Replica Set will notice that and start another pod for you to meet the configured 2 replicas specification.
But the MySQL is not there, you can see it has its own controller by using:
$ kubectl get statefulsetSince we are running two instances of the Message Service (one instance in one pod), and that the IP addresses are not only unique, but also ephemeral - how will a client reach our services? We need a way to discover the service.
In Kubernetes, Service Discovery is a first class citizen. We created a Service that will:
- act as a load balancer to load balance the requests to the pods, and
- provide a stable IP address, allow discovery from the API, and also create a DNS name!
If you login into a container (use Redis container for it), you can access the message-service via the DNS name:
$ export REDIS_POD=$(kubectl get pods -l app=redis -o jsonpath='{.items[0].metadata.name}')
$ kubectl exec -ti $REDIS_POD -- /bin/bash
root@redis:/# wget -qO- http://message-service:80/hello/Test
{"greeting":"Hello Test from message-service-... with 1.0","hostname":"message-service-...","version":"1.0"}
root@redis:/# exitYou know the drill by now.
$ cd ~/gcp-k8s-lab/kubernetes/base
$ kustomize edit add resource {ui-deployment.yaml,ui-service.yaml}
Update the application stack deployment by running the following to launch our UI Service.
$ kustomize build | kubectl apply -f -But how are our users going to access the application? We need to expose it to the external world. We can use a LoadBalancer service, but if we have multiple applications - we will have to pay for extra Google LoadBalancers. So we will use an Ingress.
Ingress exposes HTTP and HTTPS routes from outside the cluster to services within the cluster. Traffic routing is controlled by rules defined on the Ingress resource.
An Ingress may be configured to give Services externally-reachable URLs, load balance traffic, terminate SSL / TLS, and offer name based virtual hosting. An Ingress controller is responsible for fulfilling the Ingress, usually with a load balancer, though it may also configure your edge router or additional front ends to help handle the traffic.
An Ingress does not expose arbitrary ports or protocols. Exposing services other than HTTP and HTTPS to the internet typically uses a service of type Service.Type=NodePort or Service.Type=LoadBalancer.
First, let's create an ingress controller that is going to do all the hard work. Run the script that will install a Kubernetes supported NGINX Controller that can work with Google LoadBalancers.
$ kubectl apply -f https://raw.githubusercontent.com/kubernetes/ingress-nginx/controller-v1.5.1/deploy/static/provider/cloud/deploy.yamlWait a few minutes and find the LoadBalancer address in the "External IP" section of the output that we will use later to access the application:
$ export INGRESS_URL=`kubectl get svc ingress-nginx-controller -n ingress-nginx -o=jsonpath={.status.loadBalancer.ingress[0].ip}`
$ echo http://${INGRESS_URL}
Now that we have a controller we can set up our rules to actually route traffic to our application. Let's check out the ingress descriptor in ui-ingress.yaml. It tells the controller where to redirect requests depending on http paths.
apiVersion: networking.k8s.io/v1
kind: Ingress
metadata:
  name: ui-ingress
  annotations:
    kubernetes.io/ingress.class: nginx
    nginx.ingress.kubernetes.io/rewrite-target: /
spec:
  rules:
    - http:
        paths:
          - path: /
            pathType: Prefix
            backend:
              service:
                name: ui
                port:
number: 80Deploy the ingress:
$ cd ~/gcp-k8s-lab/kubernetes
$ kubectl apply -f ui-ingress.yaml
Finally, checkout the application using the ingress LoadBalancer IP you got earlier in a new browser tab.
Scaling the number of replicas of any of our services is as simple as running:
$ kubectl scale --replicas=4 deployment/message-serviceYou can very quickly see that the deployment has been updated:
$ kubectl get deployment
$ kubectl get pods
Let's scale out even more!
$ kubectl scale --replicas=20 deployment/message-serviceLet's take a look at the status of the Pods:
$ kubectl get podsOh no! Some of the Pods are in the Pending state! That is because we only have 3-5 physical nodes, and the underlying infrastructure has run out of capacity to run the containers with the requested resources.
Pick a Pod name that is associated with the Pending state to confirm the lack of resources in the detailed status:
$ kubectl describe pod message-service...The good news is that we can easily spin up more GKE Nodes instances to append to the cluster. You can add more nodes and see that pods are scheduled. This is left for you to exercise as you should know how to do it from the previous lab. Check this documentation if you forgot :)
Once you're done - reduce the number of replicas back to 2 so that we can free up resources for the later parts of the lab:
$ kubectl scale --replicas=2 deployment/message-serviceIt's easy to update & rollback.
Rolling Update
In this lab, we'll make a minor change to the index.html (e.g., change the background color, title, etc.).
After modifying the file, you'll rebuild the container and upload it to the GCR.
Use the Cloud Editor.
$ cloudshell edit ~/gcp-k8s-lab/ui/src/main/resources/templates/index.htmlMake some changes to index.html. Changing the background is always a fun one to try.
Find the style block of body that looks like:
body {
    padding-top: 80px;
}
And change it to:
body {
    padding-top: 80px;
    background-color: goldenrod;
}
Once you've made the changes, build and push a new version of the Docker container.
$ cd ~/gcp-k8s-lab/
$ ./gradlew ui:jib --image=gcr.io/${GOOGLE_CLOUD_PROJECT}/ui:v2
Because we are managing our Pods with Deployment, it simplifies re-deployment with a new image and configuration.
Edit kustomization.yaml and add the new image tag.
$ cd ~/gcp-k8s-lab/kubernetes/base
$ kustomize edit set image gcr.io/${GOOGLE_CLOUD_PROJECT}/ui=gcr.io/${GOOGLE_CLOUD_PROJECT}/ui:v2
Apply the file:
$ kustomize build | kubectl apply -f -That's it! Kubernetes will then perform a rolling update to update all the versions from 1.0 to 2.0. Wait 1-2 minutes and check the ui again or run watch kubectl get pod to see the progress of update.
Rollback a Deployment
You can see your deployment history:
$ kubectl rollout history deployment uiYou can rollback a Deployment to a previous revision:
$ kubectl rollout undo deployment ui
deployment "ui" rolled back
A single cluster can be split into multiple namespaces. Resource names (like Deployment, Service, etc) need to be unique within a namespace, but can be reused in different namespaces. i.e., you can create a namespace staging and a namespace qa. You can deploy exactly the same application into both namespaces. Each namespace can also have its own resource constraint. i.e., qa namespace can be assigned a 10 CPU cores limit while staging namespace can have more.
Create a new namespace:
$ kubectl create ns stagingSee what's deployed there:
$ kubectl --namespace=staging get pods
No resources found.
Let's deploy something!
$ cd ~/gcp-k8s-lab/kubernetes/
$ kubectl --namespace=staging apply \
 -f mysql-stateful.yaml \
 -f mysql-service.yaml \
 -f redis-deployment.yaml \
 -f redis-service.yaml
It's hard to remember every manifest you need. Kustomize to the rescue!
Let's create an overlay to our base configuration to easily change namespaces during deployment:
$ mkdir -p ~/gcp-k8s-lab/kubernetes/staging
$ cd ~/gcp-k8s-lab/kubernetes/staging
$ kustomize create --resources ../base --namespace staging
The entire application is now deployed into staging namespace:
$ cd ~/gcp-k8s-lab/kubernetes/
$ kustomize build staging | kubectl apply -f -
See what's deployed with:
$ kubectl --namespace=staging get podsIf you ever need to remove an entire environment under a namespace, simply delete the namespace:
$ kubectl delete namespace staging
namespace "staging" deleted
This will propagate and delete every resource under this namespace, including automatically provisioned external load balancers, and volumes. The operations are asynchronous. Even though the command line says the namespace was deleted - the resources are still being deleted asynchronously.
You can specify the resource needs for each of the containers within the Deployment descriptor file. By default, each container is given 10% of a CPU and no memory use restrictions. You can see the current resource by describing a Pod instance, look for the Requests/Limits lines.
$ kubectl get pods
$ kubectl describe pod message-service...
In Kubernetes, you can reserve capacity by setting the Resource Requests to reserve more CPU and memory.
apiVersion: apps/v1
kind: Deployment
metadata:
  ...
spec:
  ...
  template:
    ...
    spec:
      containers:
      - name: message-service
        image: img-name:v2
        resources:
          requests:
            cpu: 200m
            memory: 256Mi
...If the application needs to consume more CPU - that's OK as well, the applications are allowed to burst. You can also set an upper limit to how much the application burst by setting the Resource Limit:
apiVersion: apps/v1
kind: Deployment
metadata:
  ...
spec:
  ...
  template:
    ...
    spec:
      containers:
      - name: message-service
        image: img-name:v2
        resources:
          requests:
            ...
          limits:
            cpu: 500m
            memory: 512Mi
        ...
Use Cloud Editor to create a file message-patch.yaml.
$ touch ~/gcp-k8s-lab/kubernetes/base/message-patch.yaml
$ cloudshell edit ~/gcp-k8s-lab/kubernetes/base/message-patch.yaml
with the following content:
apiVersion: apps/v1
kind: Deployment
metadata:
  name: message-service
spec:
  template:
    spec:
      containers:
      - name: message-service
        resources:
          requests:
            cpu: 200m
            memory: 256Mi
          limits:
            cpu: 500m
memory: 512MiNext, use Kustomize to add this patch to our Message Service manifest:
$ cd ~/gcp-k8s-lab/kubernetes/base/
$ kustomize edit add patch --path message-patch.yaml
This will allow us to dynamically modify the deployment without altering the original file.
Redeploy the application to apply the new configuration:
$ cd ~/gcp-k8s-lab/kubernetes/
$ kustomize build base | kubectl apply -f -During rolling update, a pod is removed as soon as a newer version of pod is up and ready to serve. By default, without health checks, Kubernetes will route traffic to the new pod as soon as the pods starts. But, it's most likely that your application will take some time to start, and if you route traffic to the application that isn't ready to serve, your users (and/or consuming services) will see errors. To avoid this, Kubernetes comes with two types of checks: Liveness Probe, and Readiness Probe.
After a container starts, it is not marked as Healthy until the Liveness Probe succeeds. However, if the number of Liveness Probe failures exceeds a configurable failure threshold, Kubernetes will mark the pod unhealthy and attempt to restart the pod.
When a pod is Healthy doesn't mean it's ready to serve. You may want to warm up requests/cache, and/or transfer state from other instances. You can further mark when the pod is Ready to serve by using a Readiness Probe.
For example, the Liveness/Readiness probes can look like this:
apiVersion: apps/v1
kind: Deployment
metadata:
  ...
spec:
  ...
  template:
    ...
    spec:
      containers:
      - name: ...
        ...
        readinessProbe:
          httpGet:
            path: /
            port: 8080
        livenessProbe:
          initialDelaySeconds: 60
          httpGet:
            port: 8080
            path: /
        ...
Use Cloud Editor to create a file ui-patch.yaml
$ touch ~/gcp-k8s-lab/kubernetes/base/ui-patch.yaml
$ cloudshell edit ~/gcp-k8s-lab/kubernetes/base/ui-patch.yaml
with the Liveness Probe/Readiness probes for our UI Service:
apiVersion: apps/v1
kind: Deployment
metadata:
  name: ui
spec:
  template:
    spec:
      containers:
      - name: ui
        readinessProbe:
          initialDelaySeconds: 40
          httpGet:
            path: /actuator/health
            port: 9000
        livenessProbe:
          initialDelaySeconds: 60
          httpGet:
            port: 9000
            path: /actuator/health
Next, use Kustomize to add this patch to our UI manifest:
$ cd ~/gcp-k8s-lab/kubernetes/base/
$ kustomize edit add patch --path ui-patch.yamlRedeploy the application to apply the new configuration:
$ cd ~/gcp-k8s-lab/kubernetes/
$ kustomize build base | kubectl apply -f -The Message Service is configured to return a message that uses the following template, configured in the message/src/main/resources/application.yml file:
demo:
  greeting: Hello $name from $hostname with $version
  version: "1.0"
spring:
  application:
    name: message
  zipkin:
    baseUrl: http://zipkin:9411/
  sleuth:
    sampler:
      percentage: "1.0"
...
There are several ways to update this configuration. We'll go through a couple of them, including:
- Environmental variable
- Command line argument
- and, Config Map
Environmental Variable
Spring applications can read the override configuration directly from an environmental variable. In this case, the environmental variable is defaulted to DEMO_GREETING. You can specify the environmental variable directly in the Deployment as well.
Edit message-patch.yaml
$ cloudshell edit ~/gcp-k8s-lab/kubernetes/base/message-patch.yamladd the environmental variable (you can fully replace the content of the file with this):
apiVersion: apps/v1
kind: Deployment
metadata:
  name: message-service
spec:
  template:
    spec:
      containers:
      - name: message-service
        env:
        - name: DEMO_GREETING
          value: Hello $name from environment!
        resources:
          requests:
            cpu: 200m
            memory: 256Mi
          limits:
            cpu: 500m
            memory: 512Mi
Save the file, and then redeploy the application to apply the new configuration:
$ cd ~/gcp-k8s-lab/kubernetes/
$ kustomize build base | kubectl apply -f -
Again, through the use of Deployments, it'll update all the replicas with the new configuration!
Wait 30 sec and go back to the frontend, add a new message and you should be able to see the greeting message changed.
Command Line Argument
Edit message-patch.yaml
$ cloudshell edit ~/gcp-k8s-lab/kubernetes/base/message-patch.yamladd a configuration via the command line arguments (you can fully replace the content of the file with this):
apiVersion: apps/v1
kind: Deployment
metadata:
  name: message-service
spec:
  template:
    spec:
      containers:
      - name: message-service
        command:
          - "java"
          - "-cp"
          - "/app/resources:/app/classes:/app/libs/*"
          - "academy.softserve.message.MessageServiceApplicationKt"
        args:
        - --demo.greeting=Hello $name from args
        resources:
          requests:
            cpu: 200m
            memory: 256Mi
          limits:
            cpu: 500m
memory: 512MiSave the file, and then redeploy the application to apply the new configuration:
$ cd ~/gcp-k8s-lab/kubernetes/
$ kustomize build base | kubectl apply -f -
Check the application and submit a name and message to see it is using the new greeting string (you might need to wait for up to 30-40 seconds for service to recreate).
Using ConfigMap
In this section, we'll use a ConfigMap to configure the application. You can store multiple text-based configuration files inside of a single ConfigMap configuration. In our example, we'll store Spring's application.yml into a ConfigMap entry.
First, update the application.yml file
$ cloudshell edit ~/gcp-k8s-lab/message/src/main/resources/application.ymlReplace it with new configuration:
demo:
  greeting: Hello $name from ConfigMap
  version: "1.0"
spring:
  application:
    name: message
  zipkin:
    baseUrl: http://zipkin:9411/
  sleuth:
    sampler:
      percentage: "1.0"
    propagation-keys: x-request-id,x-ot-span-context
management:
  server:
    port: 9000
  endpoints:
    web:
      exposure:
        include: "*"
Next, create a ConfigMap entry with this file:
$ cd ~/gcp-k8s-lab/kubernetes/base
$ cp ~/gcp-k8s-lab/message/src/main/resources/application.yml ~/gcp-k8s-lab/kubernetes/base
$ kustomize edit add configmap greeting-config --disableNameSuffixHash --from-file=application.yml
There are several ways to access the values in this ConfigMap:
- Mount the entries (in our case, application.yml) as a file.
- Access from the Kubernetes API (we won't cover this today).
Edit message-patch.yaml
$ cloudshell edit ~/gcp-k8s-lab/kubernetes/base/message-patch.yamladd volumes and volume mounts (you can fully replace the content of the file with this):
apiVersion: apps/v1
kind: Deployment
metadata:
  name: message-service
spec:
  template:
    spec:
      volumes:
      - name: config-volume
        configMap:
          name: greeting-config
      containers:
      - name: message-service
        command:
          - "java"
          - "-cp"
          - "/app/resources:/app/classes:/app/libs/*"
          - "academy.softserve.message.MessageServiceApplicationKt"
        args:
        - --spring.config.location=/etc/config/application.yml
        volumeMounts:
        - name: config-volume
          mountPath: /etc/config
        resources:
          requests:
            cpu: 200m
            memory: 256Mi
          limits:
            cpu: 500m
            memory: 512Mi
This will make the configuration file available as the file /etc/config/application.yml and tell Spring Boot to use that file for configuration.
Save the file, and then redeploy the application to apply the new configuration:
$ cd ~/gcp-k8s-lab/kubernetes/
$ kustomize build base | kubectl apply -f -Let's take a look inside the newly created entry:
$ kubectl edit configmap greeting-configYou'll see that the application.yml is now part of the YAML file.
Check the application to see it is using the new greeting string.
ConfigMap is great to store text-based configurations. Depending on your use cases, it may not be the best place to store your credentials (which sometimes may be a binary file rather than text). Secrets can be used to hold sensitive information, such as passwords, OAuth tokens, and SSH keys. Entries in Secrets are Base64 encoded. However, Secrets are not additionally encrypted by default when stored in Kubernetes.
In this section, we'll create a Secret that contains the MySQL username and password. We'll subsequently update both the MySQL Deployment and the Guestbook Service to refer to the same credentials.
First, let's create a Secret with username and password the command line:
$ cd ~/gcp-k8s-lab/kubernetes/base
$ kustomize edit add secret mysql-secret --disableNameSuffixHash \
--from-literal=username=root --from-literal=password=yourpasswordIn the pods, you can access these values a couple of ways:
- Mount each entry as a file under a directory (similar to what we did with ConfigMap)
- Use Downward API to expose each entry as an Environmental Variable (which you can also do with ConfigMap).
Next, configure the Guestbook Service, by editing the Deployment and updating the Environmental Variables too.
Create a file guest-patch.yaml
$ touch ~/gcp-k8s-lab/kubernetes/base/guest-patch.yaml
$ cloudshell edit ~/gcp-k8s-lab/kubernetes/base/guest-patch.yaml
add a couple of Environmental Variables (and remove the old ones for clearer experiment):
apiVersion: apps/v1
kind: Deployment
metadata:
  name: guestbook-service
spec:
  template:
    spec:
      containers:
      - name: guestbook-service
        env:
        - name: SPRING_DATASOURCE_USERNAME
          valueFrom:
            secretKeyRef:
              name: mysql-secret
              key: username
        - name: SPRING_DATASOURCE_PASSWORD
          valueFrom:
            secretKeyRef:
              name: mysql-secret
              key: password
        - name: DB_HOST
          value: mysql
        - name: DB_USER
          $patch: delete
        - name: DB_PASS
          $patch: delete
Next, use Kustomize to add this patch to our Guestbook Service manifest:
$ cd ~/gcp-k8s-lab/kubernetes/base/
$ kustomize edit add patch --path guest-patch.yaml
Redeploy the application to apply the new configuration:
$ cd ~/gcp-k8s-lab/kubernetes/
$ kustomize build base | kubectl apply -f -
Once the deployment is completed, check that the application is still working.
If you look into the newly created Secret, you'll see that the values are Base64 encoded:
$ kubectl edit secret mysql-secret
apiVersion: v1
data:
  password: eW91cnBhc3N3b3Jk
  username: cm9vdA==
kind: Secret
...As our database is not managed by kustomize, we can manually edit the stateful set manifest. Edit the file mysql-stateful.yaml
$ cloudshell edit ~/gcp-k8s-lab/kubernetes/mysql-stateful.yamland find the environment variables section that looks like this:
apiVersion: apps/v1
kind: StatefulSet
metadata:
  name: mysql
  ...
spec:
  ...
  template:
    ...
    spec:
      containers:
      - name: mysql
        ...
        env:
        - name: MYSQL_ROOT_PASSWORD
          # change this
          value: yourpassword
        - name: MYSQL_DATABASE
          value: app
        ...
Edit it to reference the same secret:
apiVersion: apps/v1
kind: StatefulSet
metadata:
  name: mysql
  ...
spec:
  ...
  template:
    ...
    spec:
      containers:
      - name: mysql
        ...
        env:
        - name: MYSQL_ROOT_PASSWORD
          valueFrom:
            secretKeyRef:
              name: mysql-secret
              key: password
        - name: MYSQL_DATABASE
          value: app
        ...
We can deploy MySQL as a StatefulSet:
$ cd ~/gcp-k8s-lab/kubernetes/
$ kubectl apply -f mysql-stateful.yaml --record
Wait a minute for MySQL to restart with the password from secret and check if the application is working.
Google Kubernetes Engine has built-in Horizontal Pod Autoscaling based on CPU utilization (and custom metrics!). We will cover autoscaling based on CPU utilization in this lab.
To set up horizontal auto scaling is extremely simple:
$ kubectl autoscale deployment message-service --min=2 --max=10 --cpu-percent=80Behind the scenes, Kubernetes will periodically (by default, every 30 seconds) collect CPU utilization and determine the number of pods needed.
You can see the current status of the autoscaler by using the describe command:
$ kubectl describe hpa message-serviceSo far, the lab has been showing how to run long running serving processes. What if you need to run a one-time job, such as a batch process, or simply leveraging the cluster to compute a result (like computing digits of Pi)? You shouldn't use Replica Sets and Deployments to run a job that is expected to exit once it completes the computation (otherwise, upon exit, it'll be restarted again!).
Kubernetes supports running these run-once jobs, which it'll create one or more pods and ensures that a specified number of them successfully terminate. When a specified number of successful completions is reached, the job itself is complete. In many cases, you'll have run a job that only needs to be completed once.
Let's create a Job to generate the load for our HPA.
To create a simple job paste the following into console:
cat <<EOF | kubectl apply -f -
apiVersion: batch/v1
kind: Job
metadata:
  name: job1
spec:
  backoffLimit: 4
  template:
    spec:
      containers:
        - command:
            - /bin/sh
            - '-c'
            - ab -n 50000 -c 1000 http://message-service:80/hello/test/
          image: 'httpd:alpine'
          name: scale-deployment
      restartPolicy: OnFailure
EOF
You'll be able to see the status of the job via the command line:
$ kubectl describe jobs job1Then, you can use kubectl logs to retrieve the job output:
$ export JOB_POD=$(kubectl get pods -l job-name=job1 -o jsonpath='{.items[0].metadata.name}')
$ kubectl logs $JOB_POD
Check the Pods, you should see the Message Service is being autoscaled. Most of them are in Pending state, as there are not enough resources in the cluster.
$ kubectl get podsMonitoring in GKE
By default, you create a Kubernetes Cluster with Stackdriver Kubernetes Monitoring support. That means we can monitor the health of the Kubernetes cluster.
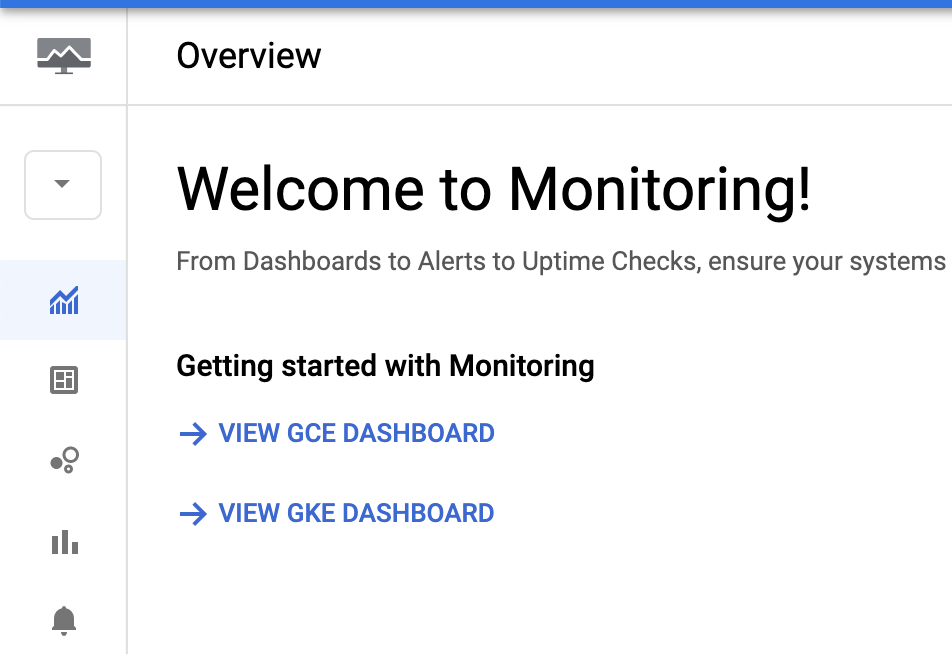
Open the Google Cloud Platform console. Navigate to Operations → Monitoring → Overview to open the Stackdriver Monitoring console. This may take a few minutes.
When the overview is open - click View GKE Dashboard to view Kubernetes Monitoring dashboard.
Explore the dashboard to see what metrics are collected.
Monitoring in Kubernetes
Traditionally, Java applications are monitored via JMX metrics, which may have metrics on thread count, heap usage, etc. In the Cloud Native world where you monitor more than just Java stack, you need to use more generic metrics formats, such as Prometheus.
Prometheus's main features are:
- a multi-dimensional data model with time series data identified by metric name and key/value pairs
- PromQL, a flexible query language to leverage this dimensionality
- no reliance on distributed storage; single server nodes are autonomous
- time series collection happens via a pull model over HTTP
- pushing time series is supported via an intermediary gateway
- targets are discovered via service discovery or static configuration
- multiple modes of graphing and dashboarding support
Spring Boot can expose metrics information via Spring Boot Actuator, and with the combination of Micrometer, it can expose all the metrics with the Prometheus format. It is easy to add Prometheus support.
If you are not using Spring Boot, you can expose JMX metrics via Prometheus by using a Prometheus JMX Exporter agent.
Our application is already configured for exporting metrics to Prometheus. Let's check it out!
Find the pod name for one of the instances of Message, UI or Guestbook services.
$ kubectl get pods -l 'app in (message-service,ui,guestbook-service)'

NAME                                 READY     STATUS    RESTARTS   AGE
guestbook-service-xxxxxxxxxx-zzzzz   1/1       Running   0          20m
message-service-xxxxxxxxxx-zzzzz     1/1       Running   0          15m
ui-xxxxxxxxxx-zzzzz                  1/1       Running   0          5m
Establish a port forward to one of the pods, for example UI:
$ kubectl port-forward ui-... 9000:9000In a new Cloud Shell tab, use curl to access the Prometheus endpoint.
$ curl http://localhost:9000/actuator/prometheus

# HELP jvm_threads_daemon_threads The current number of live daemon threads
# TYPE jvm_threads_daemon_threads gauge
jvm_threads_daemon_threads 31.0
# HELP zipkin_reporter_messages_dropped_total
# TYPE zipkin_reporter_messages_dropped_total counter
zipkin_reporter_messages_dropped_total{cause="ResourceAccessException",} 69.0
# HELP zipkin_reporter_queue_bytes Total size of all encoded spans queued for reporting
# TYPE zipkin_reporter_queue_bytes gauge
zipkin_reporter_queue_bytes 0.0
...
All of these metrics are going to be available inside of Stackdriver Monitoring for visualization, building dashboards, and also setting up alerts. Some of these metrics, like jvm_memory_committed_bytes, have multiple dimensions (area and id). These dimensions will also be filterable/groupable within Stackdriver Monitoring too.
Close the second Cloud Shell tab and in the first tab stop the port forwarding with Ctrl+C.
Stackdriver Kubernetes Monitoring can monitor Prometheus metrics from the Kubernetes cluster. Let's install Prometheus support to the cluster.
We will be using the Prometheus Operator, that provides Kubernetes native deployment and management of Prometheus and related monitoring components.
Install a quickstart Prometheus operator:
$ kubectl apply -f https://github.com/prometheus-operator/prometheus-operator/releases/download/v0.56.2/bundle.yaml \
  --force-conflicts=true \
--server-sideProvision Prometheus using the Prometheus Operator.
$ cd ~/gcp-k8s-lab/kubernetes/
$ /bin/sed "s/PROJECT_ID_GCP/${GOOGLE_CLOUD_PROJECT}/g" prometheus.yaml.tpl > prometheus.yaml
$ kubectl apply -f prometheus.yamlNext, we'll use the simplest kind of monitoring configuration - PodMonitor.
$ cd ~/gcp-k8s-lab/kubernetes/
$ kubectl apply -f pod-monitor.yaml
Let's validate Prometheus is running properly and scraping the data. Establish a port forward to Prometheus' port.
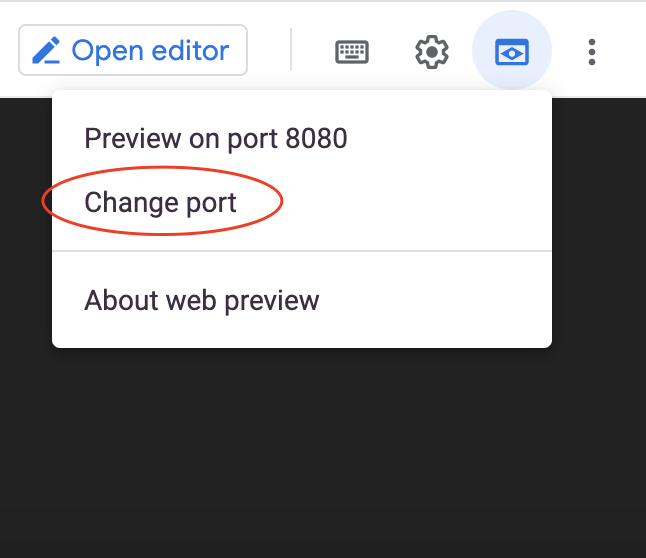
$ kubectl port-forward svc/prometheus 9090:9090Use Cloud Shell's Web Preview and change port to 9090.
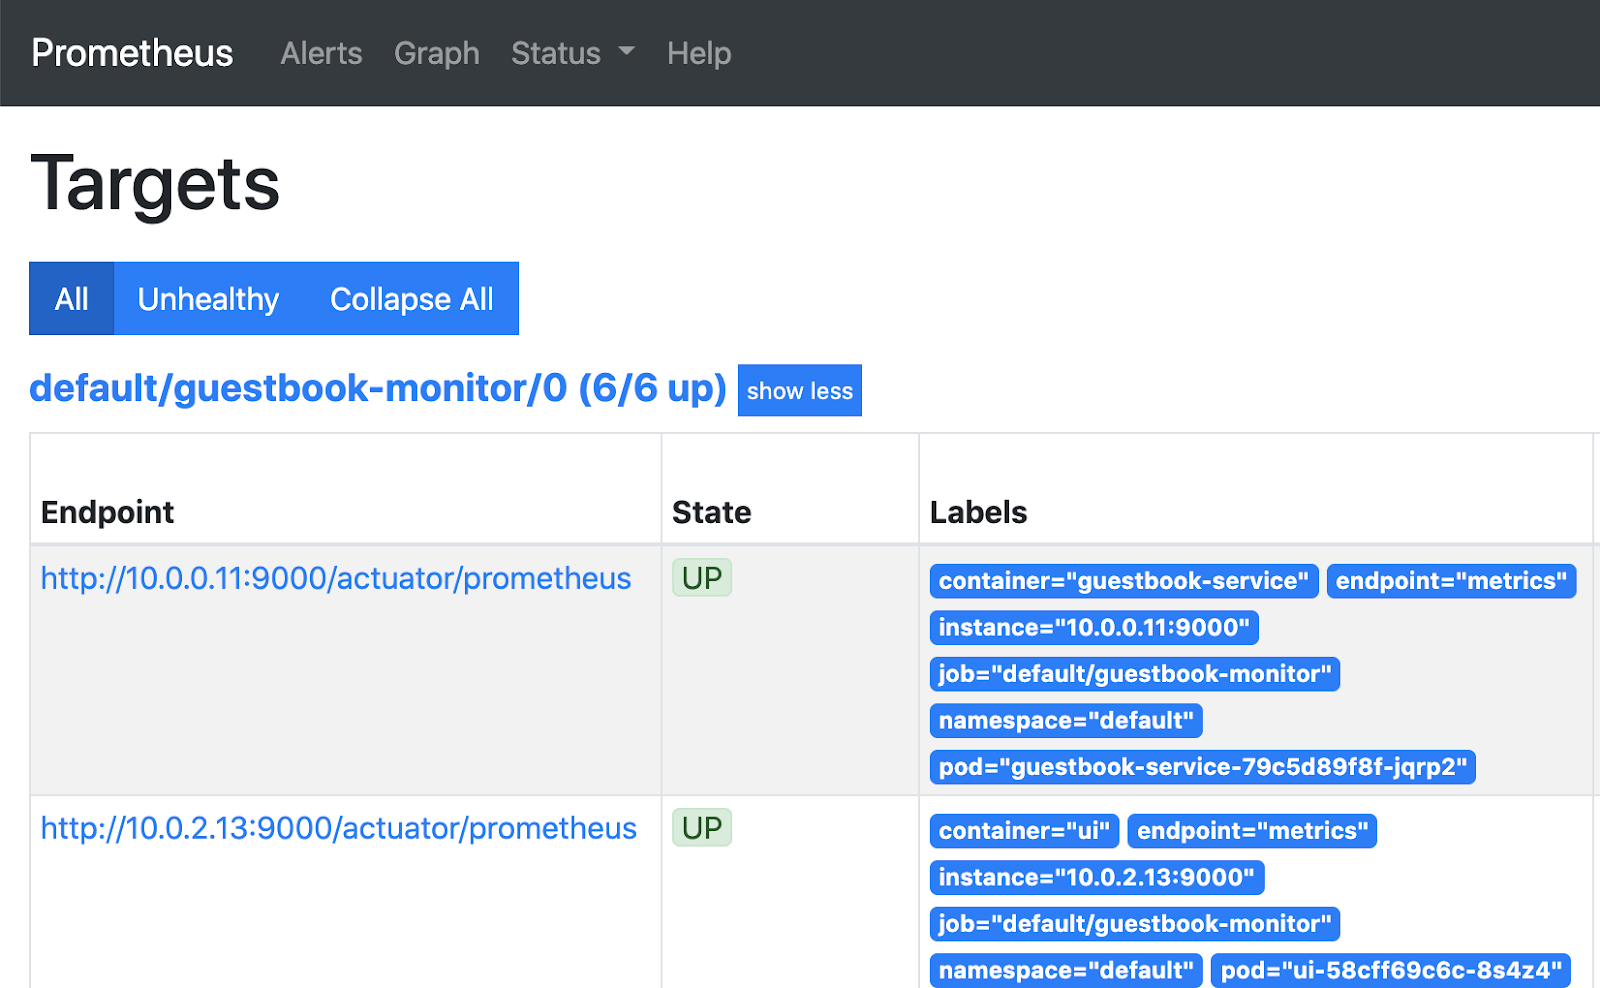
In the Prometheus console, select Status → Targets.
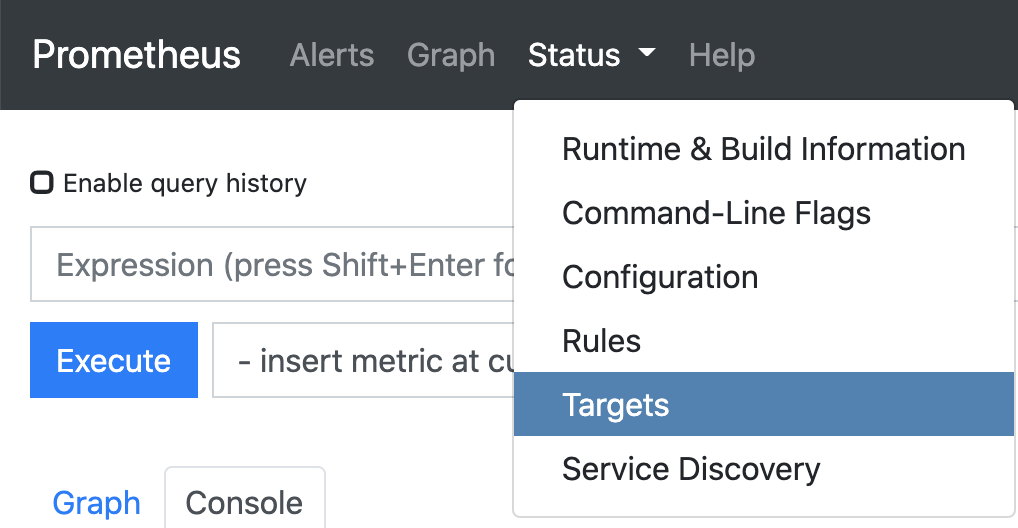
Observe that there are 6 targets (pods) being scrapped for metrics.
Explore the metrics in Prometheus
Navigate to Graph.
In the Expression field enter jvm_memory_used_bytes and press Execute.
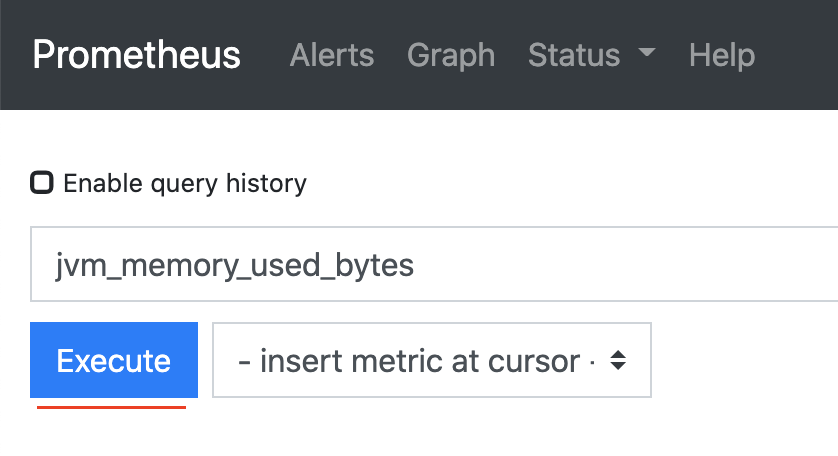
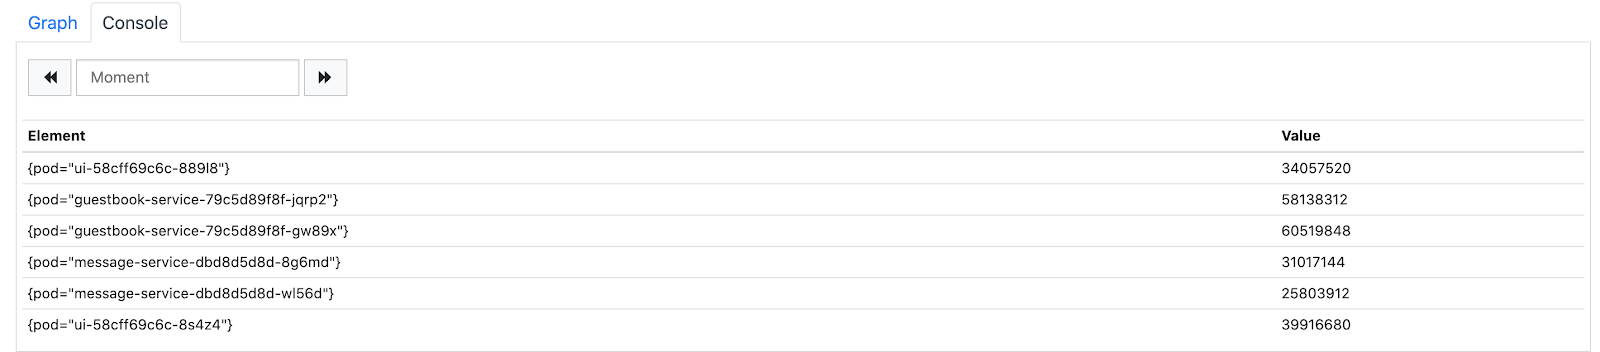
In the Console tab below you should see all available metrics and their dimensions.
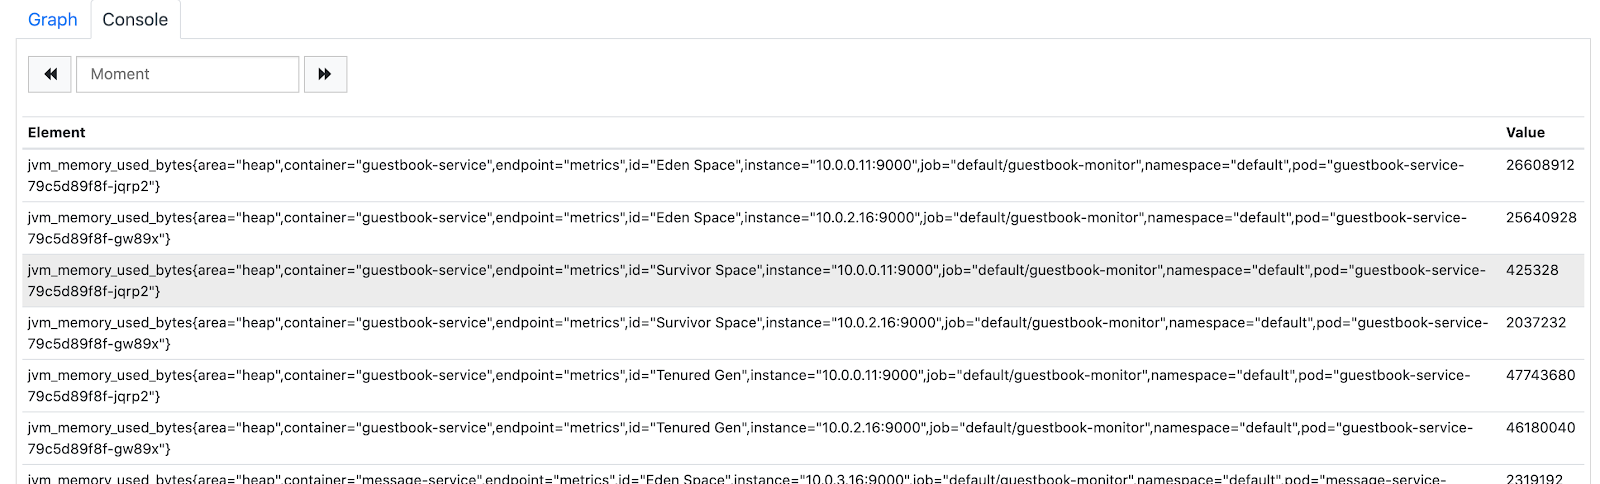
It doesn't give us much information. Let's modify the query to filter by area dimension and sum it by pod dimension.
Enter the following in the Expression and press execute.
sum by (pod) (jvm_memory_used_bytes{area="heap"})This will give us the total memory our Java applications are using per pod.
Click the Graph tab to see a graph of our memory usage (check the stacked box to make it prettier).
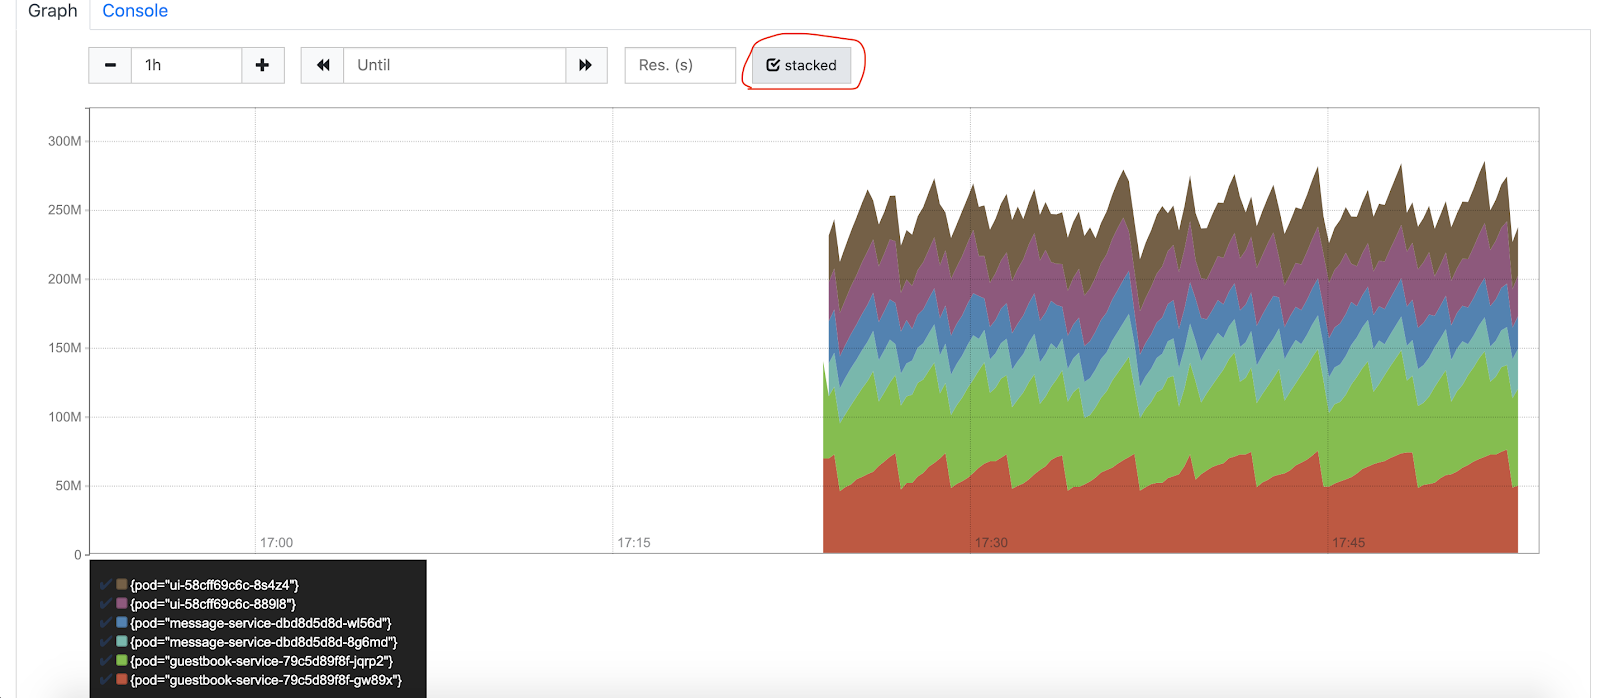
Prometheus is good for scrapping metrics, but it is not great for visualization. Let's head to the next step.
Explore the metrics in Stackdriver
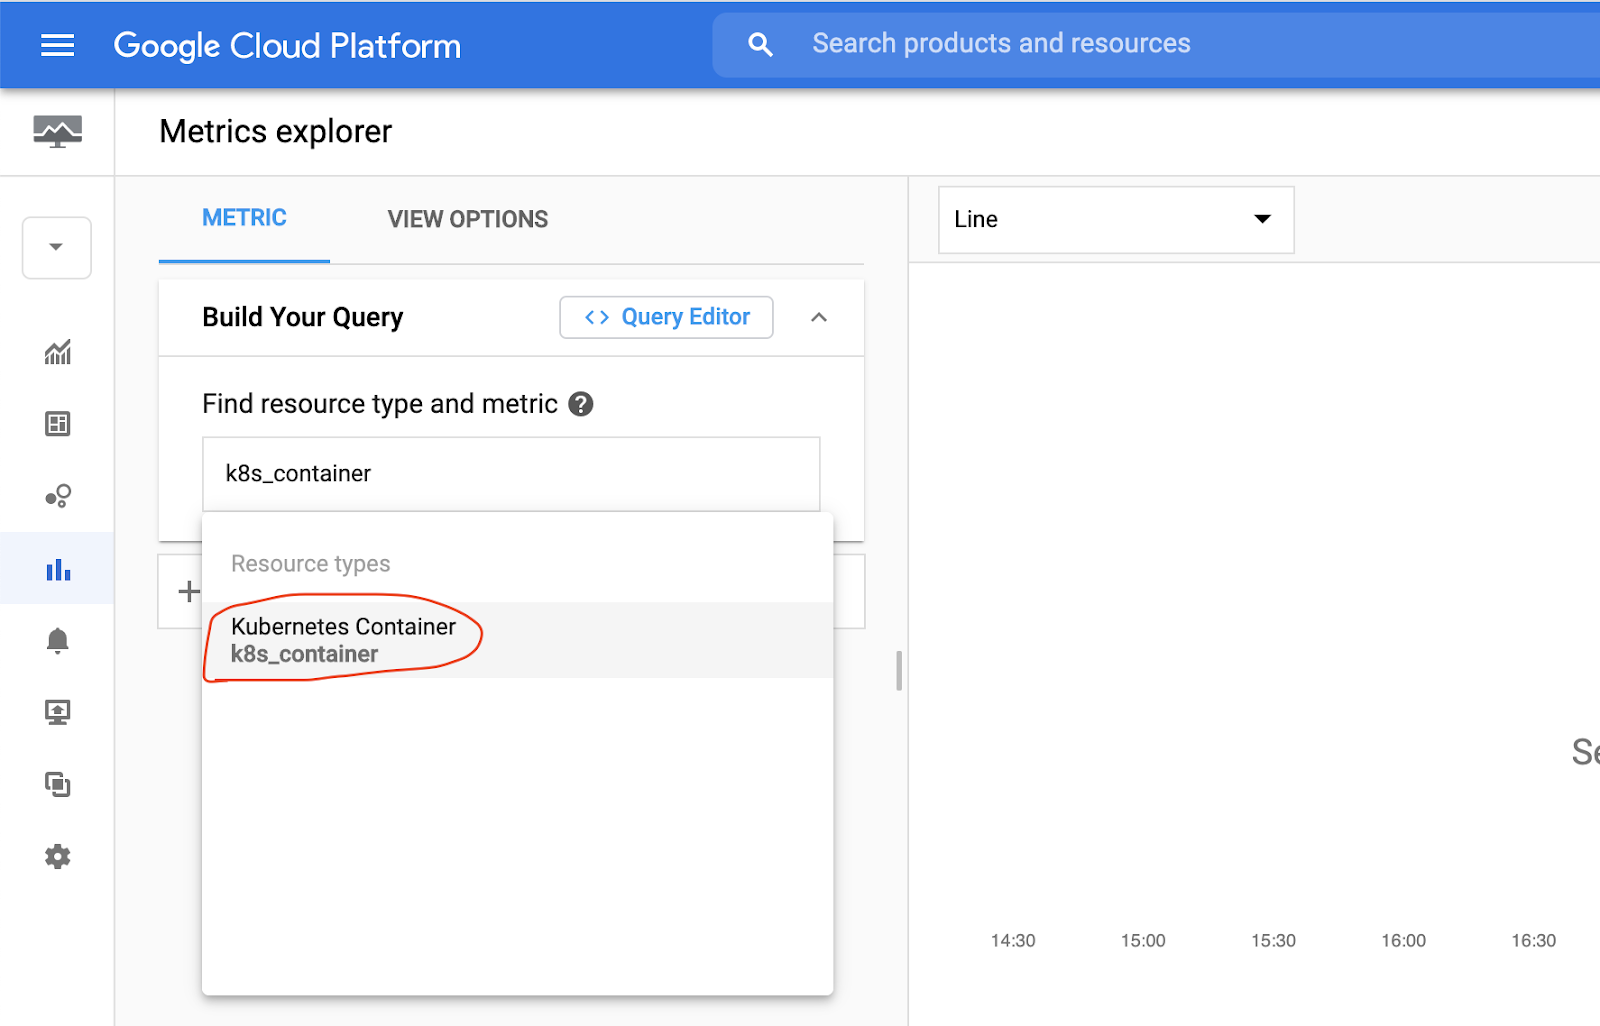
Navigate to the Operations → Monitoring → Metrics Explorer.
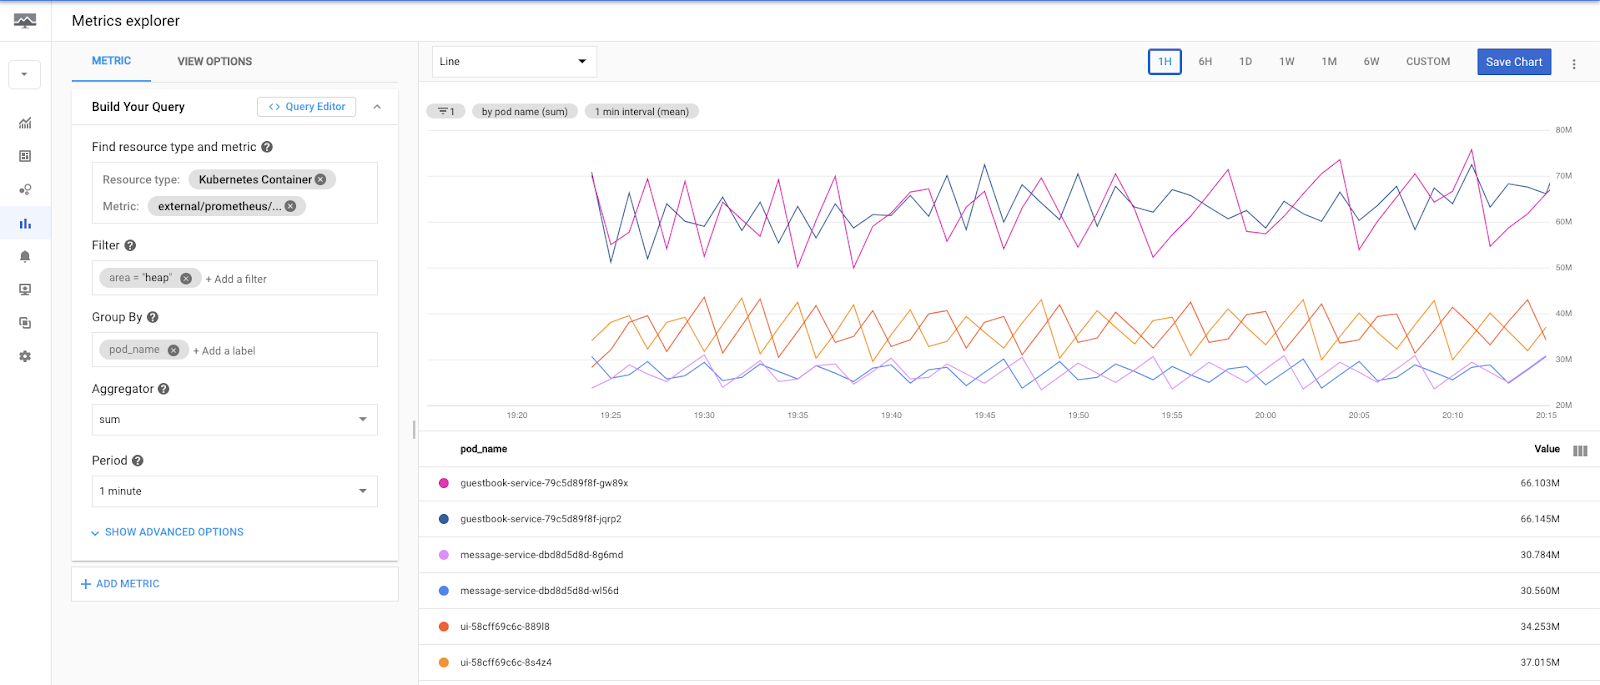
In the Metrics Explorer, search for k8s_container Resource type and select it.
Then, in metrics search for jvm_memory_used_bytes to find some metrics collected by the Prometheus Agent from Spring Boot applications.
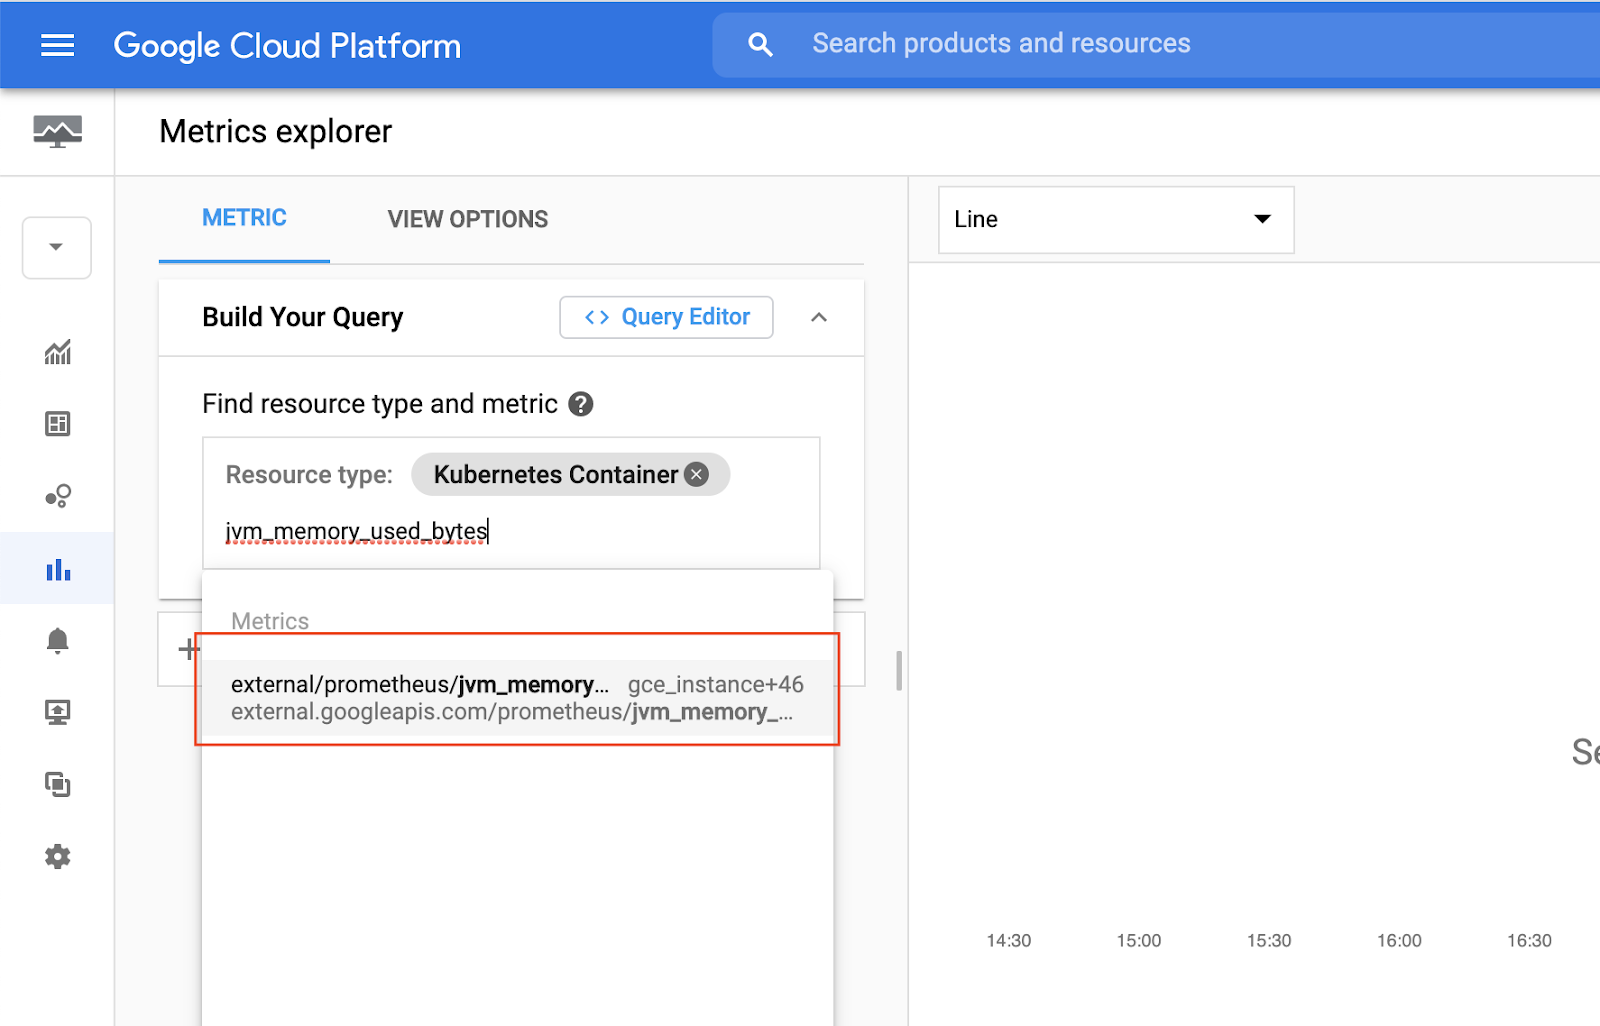
Select external/prometheus/jvm_memory_used_bytes to plot the metrics.
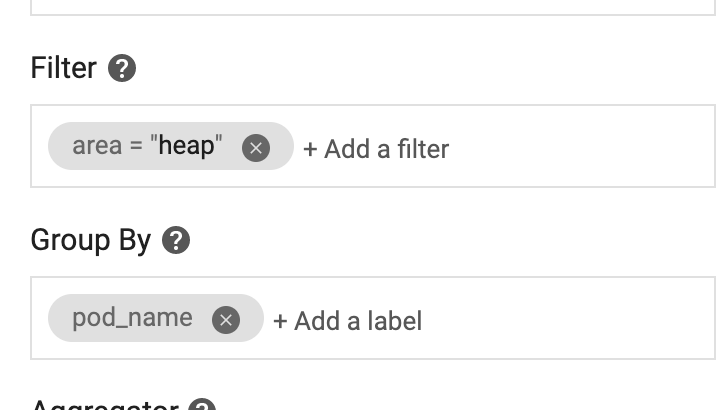
In Filter click Add a filter to filter by area=heap.
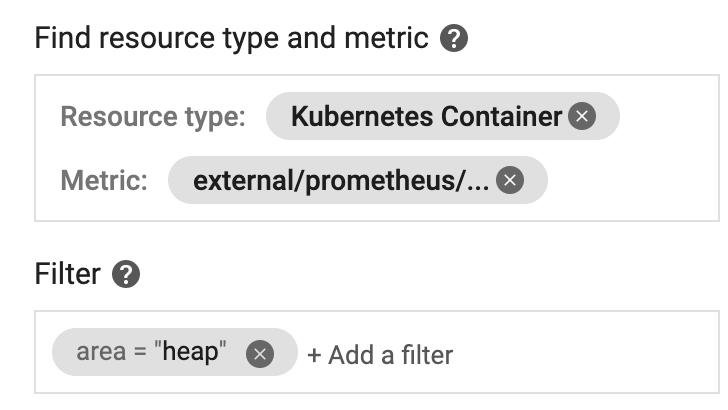
In Group by, group by pod_name.
In Aggregation, select Sum.
This should build a graph of current Heap usage of our applications.
You can play with other metrics and move to the next step.
Observability in a Microservices architecture
Kubernetes has become the de-facto orchestrator for microservices infrastructure and deployment. The ecosystem is extremely rich and one of the fastest growing in the open-source community.
Distributed tracing enables capturing requests and building a view of the entire chain of calls made all the way from user requests to interactions between hundreds of services. It also enables instrumentation of application latency (how long each request took), tracking the lifecycle of network calls (HTTP, RPC, etc) and also identifies performance issues by getting visibility on bottlenecks.
We saw an example of using Stackdriver Trace with AppEngine, but we can deploy a custom solution in our cluster.
As an example of distributed tracing we will use an already setup integration of Spring with Zipkin.
Deploy Zipkin deployment and service:
$ cd ~/gcp-k8s-lab/kubernetes/
$ kubectl apply -f zipkin-deployment.yaml -f zipkin-service.yaml
Establish a port forward to Zipkin's port.
$ kubectl port-forward svc/zipkin 9411:9411Use Cloud Shell's Web Preview and change port to 9411.
Go back to our UI and refresh it a couple of times and post a new message.
In Zipkin, click Dependencies.

Then, make sure you select the right date and press the search button. You should see our services connected with each other.
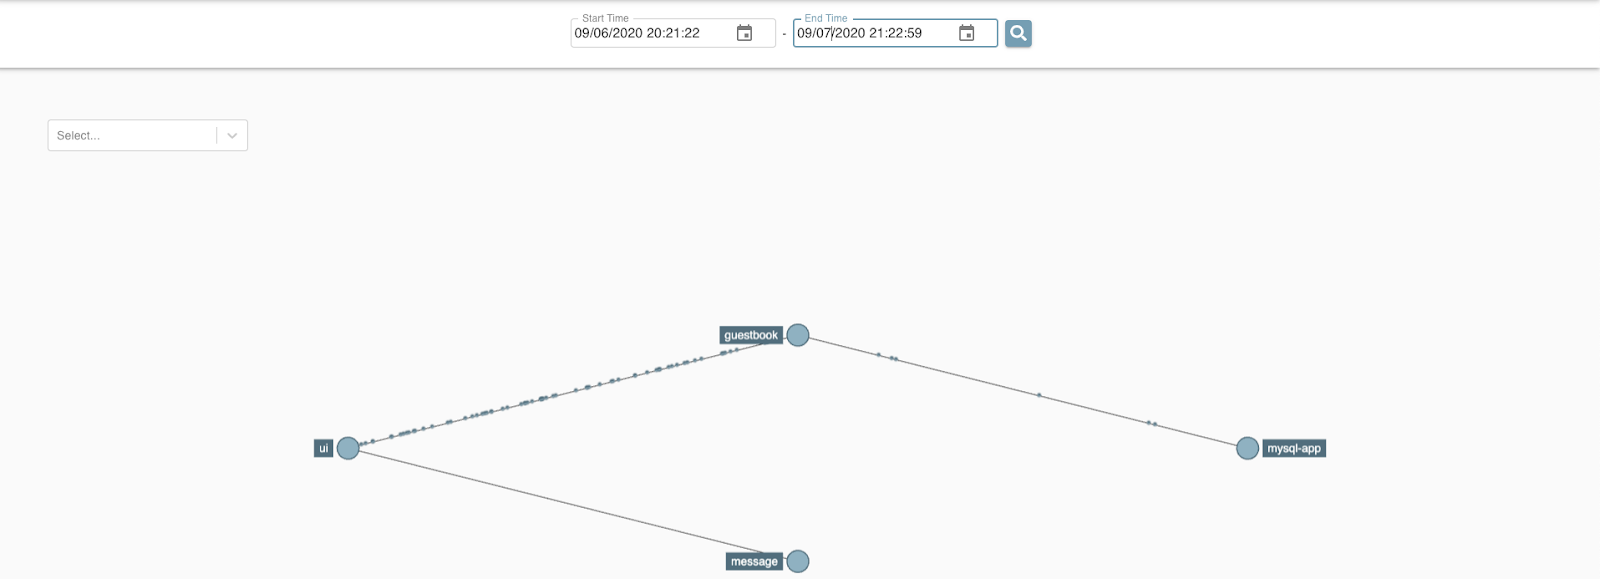
Click the UI to see which services it is connected with.
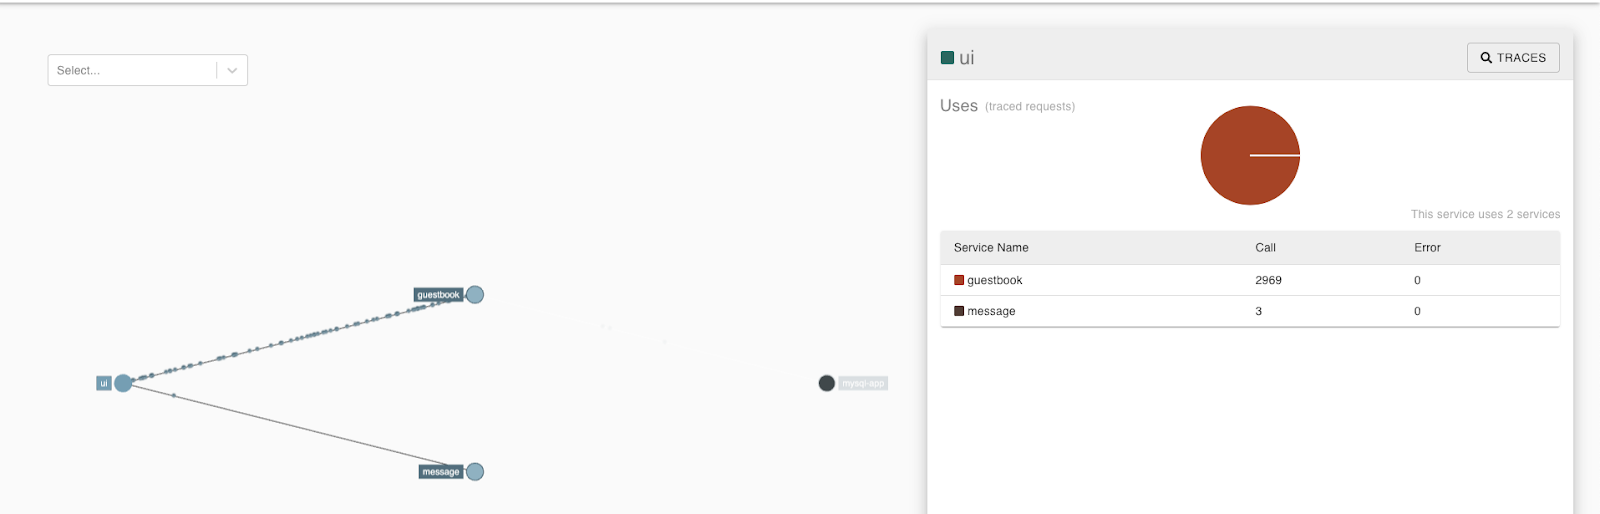
Then, click the Traces button in the right corner.
Make sure the ui service is selected and press the Run Query button.

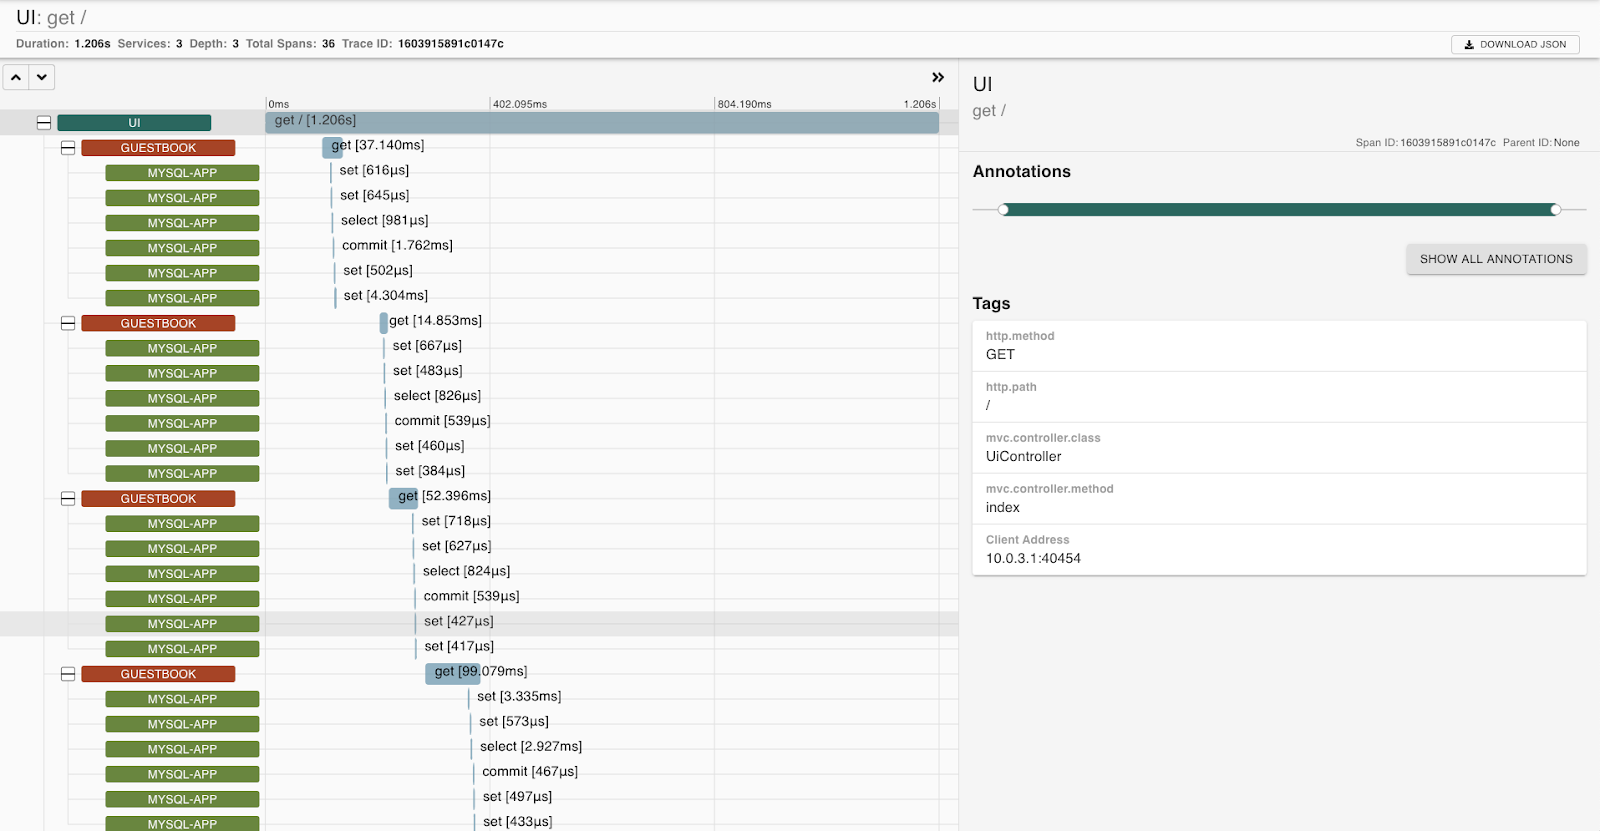
Select any of the available traces and click Show.
You should see the trace details.
Delete the Ingress controller to delete the Load Balancer.
$ kubectl delete -f https://raw.githubusercontent.com/kubernetes/ingress-nginx/controller-v1.5.1/deploy/static/provider/cloud/deploy.yamlTo delete the image from registry enter the following.
$ gcloud container images list --format="json" | \
  jq .[].name | xargs -I {} gcloud container images delete \
  --force-delete-tags --quiet {}
In the Management Console, from the Products and Services menu, go to the Container Registry service. You should see your image is gone.
Next, delete the cluster
$ gcloud container clusters delete devops-cluster --zone europe-west1-bFinally, check if there are any persistent disks left and delete them:
$ gcloud compute disks list --format="json" | jq .[].name | \
  grep "devops-cluster" | xargs gcloud compute disks delete --zone europe-west1-b
Thank you! :)