Last Updated: 2020-08-22
Kubernetes
Kubernetes is an open source project (available on kubernetes.io) which can run on many different environments, from laptops to high-availability multi-node clusters, from public clouds to on-premise deployments, from virtual machines to bare metal.
Kubernetes operations (kops) acts as a kubectl for clusters.
kops helps you create, destroy, upgrade and maintain production-grade, highly available, Kubernetes clusters from the command line. AWS (Amazon Web Services) is currently officially supported, with GCE and OpenStack in beta support.
What you'll build
In this codelab, you're going to deploy a Kubernetes cluster in GCP using Kops.
What you'll need
- A recent version of your favourite Web Browser
- Basics of BASH
- GCP Account
Create an Account
In this step, you register for the Google Cloud Platform free trial and create a project. The free trial provides you:
- $300 Credit for Free
- Access to Google Cloud Platform Products
- You Won't be Billed (though you need to enter your credit card)
- Build with the Power, Speed, Security, Reliability, and Scalability of Google
To register for the free trial open the free trial Registration page.
If you do not have a Gmail account, follow the steps to create one. Otherwise, login and complete the registration form.
Read and agree to the terms of service. Click Accept and start a free trial.
Create a Project
Next, create your first project using the Google Cloud Platform Console. The project is used to complete the rest of the lab.
To create a project in the Google Cloud Platform Console, click Select a project > Create a project.
In the New Project dialog: for Project name, type whatever you like. Make a note of the Project ID in the text below the project name box; you need it later. Then click Create.
Upgrade Account (Optional)
In the upper-right corner of the console, a button will appear asking you to upgrade your account. Click Create a Project when you see it. If the Upgrade button does not appear, you may skip this step. If the button appears later, click it when it does.
When you upgrade your account, you immediately have access to standard service quotas, which are higher than those available on the free trial.
Finalize
On the GCP Console, use the left-hand side menu to navigate to Compute Engine and ensure that there are no errors.
At the end of this lab, you may delete this project and close your billing account if desired.
Open CloudShell
You will do most of the work from the Google Cloud Shell, a command line environment running in the Cloud. This virtual machine is loaded with all the development tools you'll need (docker, gcloud, kubectl and others) and offers a persistent 5GB home directory and runs in Google Cloud, greatly enhancing network performance and authentication. Open the Google Cloud Shell by clicking on the icon on the top right of the screen:

You should see the shell prompt at the bottom of the window:
Once connected to Cloud Shell, you should see that you are already authenticated and that the project is already set to your project ID.
Run the following command in Cloud Shell to confirm that you are authenticated
gcloud auth listIf it's the first time you are running Cloud Shell - authorize it.
You might need to run the command again after authorization. Command output:
 Credentialed Accounts
ACTIVE  ACCOUNT
*       <my_account>@<my_domain.com>

To set the active account, run:
$ gcloud config set account `ACCOUNT`Check if your project is set correctly.
gcloud config list projectCommand output
[core]
project = <PROJECT_ID>
If it is not, you can set it with this command:
gcloud config set project <PROJECT_ID>Install Kops
Run the following command to install the latest version of kops.
$ curl -Lo kops https://github.com/kubernetes/kops/releases/download/$(curl -s https://api.github.com/repos/kubernetes/kops/releases/latest | grep tag_name | cut -d '"' -f 4)/kops-linux-amd64
$ chmod +x ./kops
$ sudo mv ./kops /usr/local/bin/
Initial setup
Enable the Compute API.
$ gcloud services enable compute.googleapis.comkops needs a state store to hold the configuration for your clusters. The simplest configuration for Google Cloud is to store it in a Google Cloud Storage bucket in the same account, so that's how we'll start.
Create an empty bucket, for example:
$ export PROJECT=`gcloud config get-value project`
$ gsutil mb -l europe-west3 gs://${PROJECT}-state-store/
If the name is taken and you receive an error - change the name and try again.
Next, rather than typing the different command argument every time, it's much easier to export the PROJECT, KOPS_STATE_STORE and NAME variables to previously setup bucket name and a cluster name that ends with .k8s.local, for example:
$ export PROJECT=`gcloud config get-value project`
$ export NAME="mycoolcluster.k8s.local" #SHOULD END WITH .k8s.local
$ export KOPS_STATE_STORE="gs://${PROJECT}-state-store"
$ export KOPS_FEATURE_FLAGS=AlphaAllowGCE # to unlock the GCE features
Option 1: Create Cluster without Metrics Server
Now you are ready to create the cluster:
$ kops create cluster \
    --name ${NAME} \
    --state ${KOPS_STATE_STORE} \
    --node-count 3 \
    --master-count=3 \
    --zones europe-west3-a,europe-west3-b,europe-west3-c \
    --master-zones europe-west3-a,europe-west3-b,europe-west3-c \
    --node-size e2-small \
    --master-size e2-small \
    --master-volume-size=20 \
    --node-volume-size=20 \
    --cloud=gce \
--yesWait 5-10 minutes till the cluster is ready. You can check its state by periodically running validate:
$ kops validate cluster --wait 10m
....
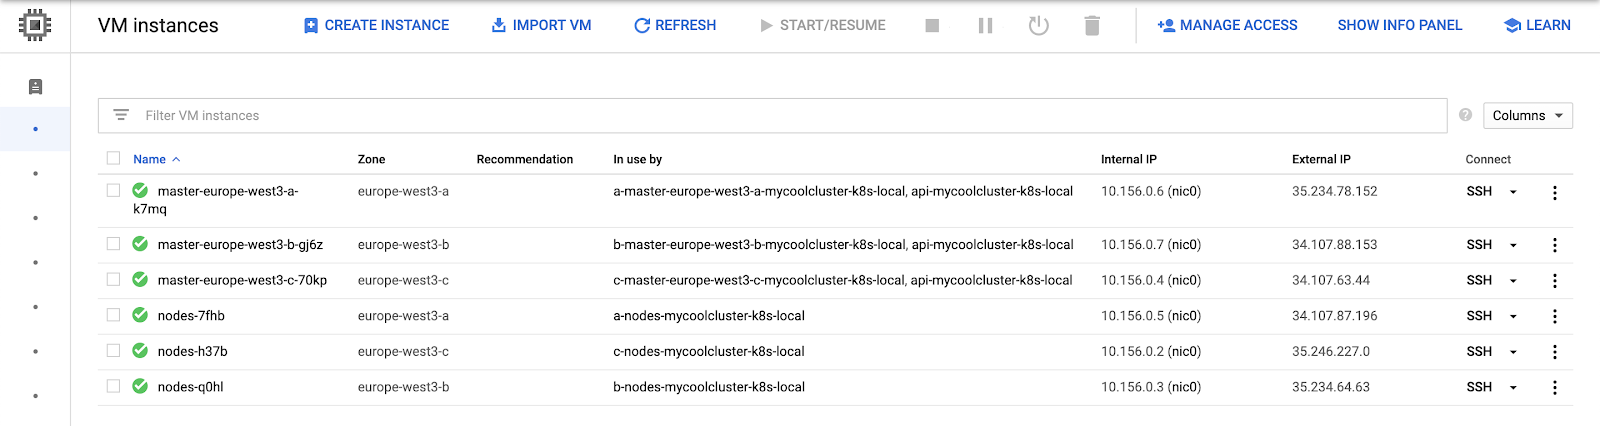
Your cluster mycoolcluster.k8s.local is readyWhile you wait, from the Google Cloud Platform console, navigate to Compute Engine → VM Instances.
You should see your nodes coming up.
Option 2: Create Cluster with Metrics Server
Metrics Server is a scalable, efficient source of container resource metrics for Kubernetes built-in autoscaling pipelines.
Metrics Server collects resource metrics from Kubelets and exposes them in Kubernetes apiserver through Metrics API for use by Horizontal Pod Autoscaler and Vertical Pod Autoscaler. Metrics API can also be accessed by kubectl top, making it easier to debug autoscaling pipelines.
Metrics Server is not meant for non-autoscaling purposes. For example, don't use it to forward metrics to monitoring solutions, or as a source of monitoring solution metrics.
Metrics Server offers:
- A single deployment that works on most clusters (see Requirements)
- Scalable support up to 5,000 node clusters
- Resource efficiency: Metrics Server uses 0.5m core of CPU and 4 MB of memory per node
Now you are ready to create the cluster:
$ kops create cluster \
    --name ${NAME} \
    --state ${KOPS_STATE_STORE} \
    --node-count 3 \
    --master-count=3 \
    --zones europe-west3-a,europe-west3-b,europe-west3-c \
    --master-zones europe-west3-a,europe-west3-b,europe-west3-c \
    --node-size e2-small \
    --master-size e2-small \
    --master-volume-size=20 \
    --node-volume-size=20 \
--cloud=gceWhen cluster configuration is ready, edit it:
$ kops edit cluster ${NAME}In the Vim editor - find the section mentioning kublet that looks like this:
  kubelet:
    anonymousAuth: false
Edit it so it looks like the next snippet:
  kubelet:
    anonymousAuth: false
    authorizationMode: Webhook
    authenticationTokenWebhook: true
After saving the document, run the following set of commands:
$ kops update cluster ${NAME} --yesWait 5-10 minutes till the cluster is ready. You can check its state by periodically running validate:
$ kops validate cluster --wait 10m
....
Your cluster mycoolcluster.k8s.local is ready
While you wait, from the Google Cloud Platform console, navigate to Compute Engine → VM Instances.
You should see your nodes coming up.
After the cluster is ready, apply the following manifest to enable metrics collection inside:
$ kubectl apply -f https://raw.githubusercontent.com/kubernetes/kops/master/addons/metrics-server/v1.16.x.yamlWait 2-5 minutes for the metrics server to start collecting metrics. Check if everything is fine by running:
$ kubectl top nodesAdd dashboard
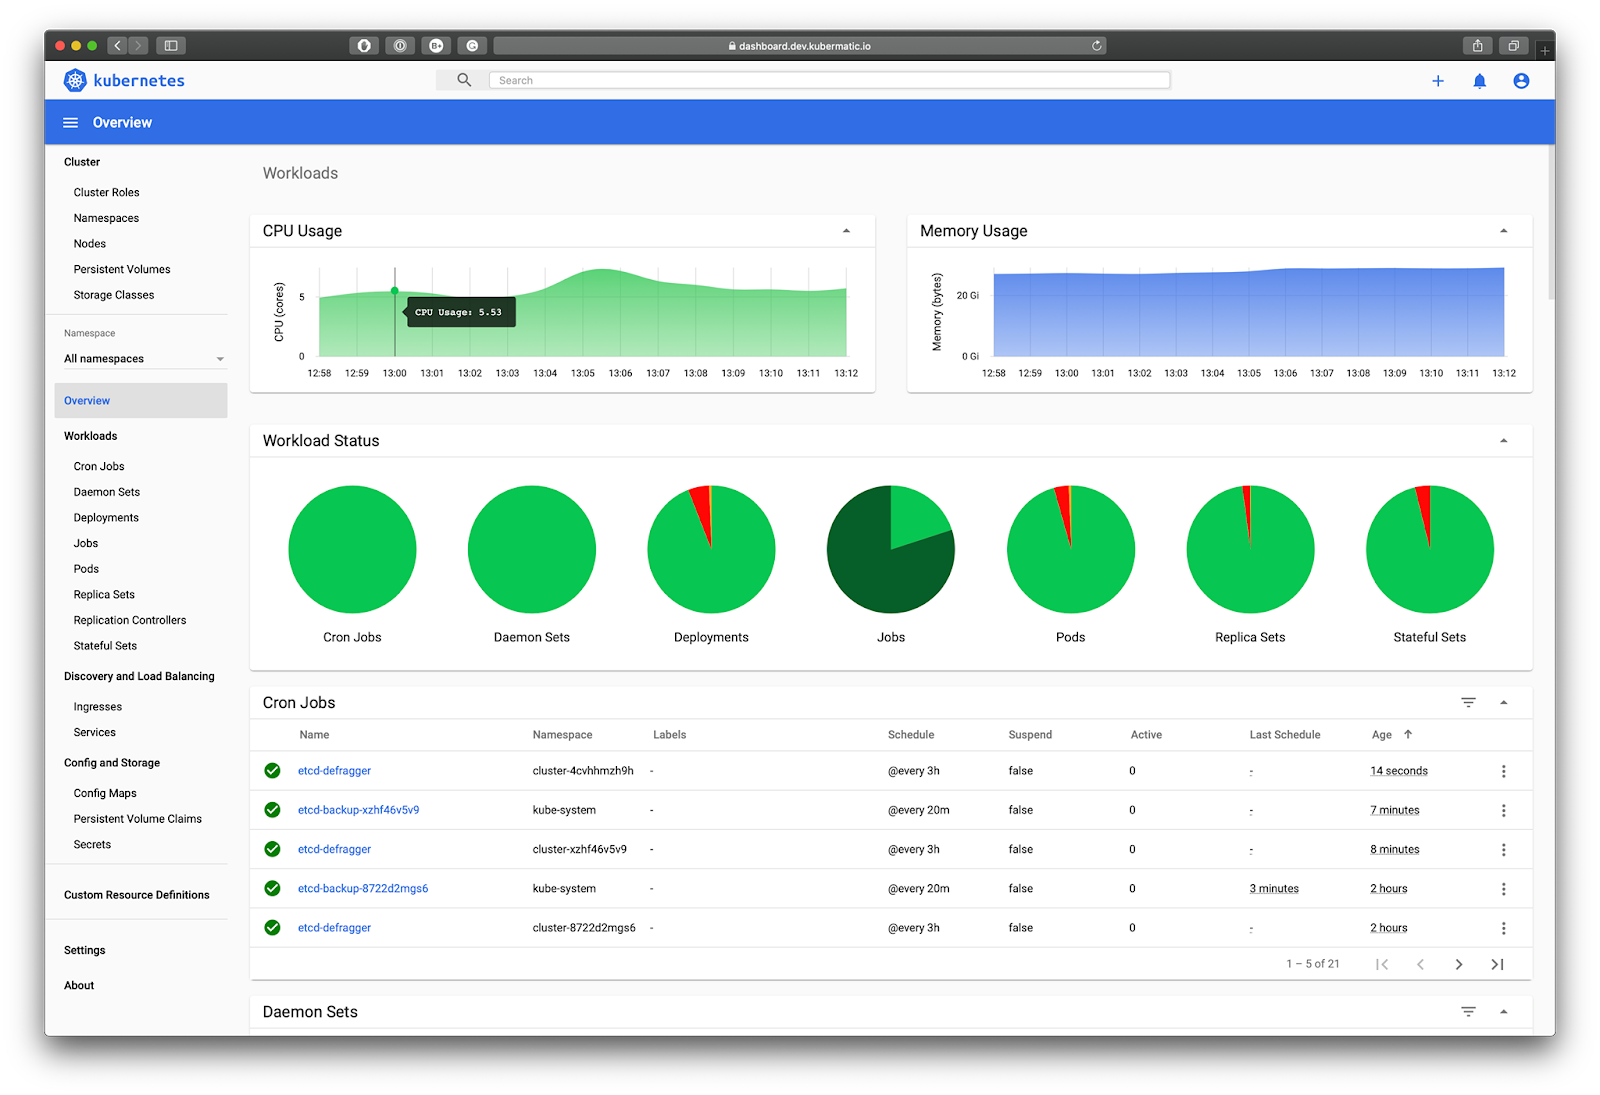
Kubernetes Dashboard is a general purpose, web-based UI for Kubernetes clusters. It allows users to manage applications running in the cluster and troubleshoot them, as well as manage the cluster itself.
To install the dashboard in your cluster run the following commands.
First, make sure that you are using your cluster and create dashboard resources.
$ kubectl config use-context ${NAME}
$ kubectl apply -f https://raw.githubusercontent.com/kubernetes/dashboard/v2.0.3/aio/deploy/recommended.yaml
Next, create an admin service account to access the dashboard:
$ cat <<EOF | kubectl apply -f -
apiVersion: v1
kind: ServiceAccount
metadata:
  name: admin-user
  namespace: kubernetes-dashboard
---
apiVersion: rbac.authorization.k8s.io/v1
kind: ClusterRoleBinding
metadata:
  name: admin-user
roleRef:
  apiGroup: rbac.authorization.k8s.io
  kind: ClusterRole
  name: cluster-admin
subjects:
- kind: ServiceAccount
  name: admin-user
  namespace: kubernetes-dashboard
EOF
Finally, run the following command.
$ kubectl -n kubernetes-dashboard get secret $(kubectl -n kubernetes-dashboard get secret | grep admin-user | awk '{print $1}') -o=jsonpath="{.data.token}" | base64 -d | xargs echo

# Output is a long JWT token string of your Admin account
Open a new Cloud Shell tab on your machine and run the following set of command to proxy the Kubernetes API to your Cloud Shell:
$ kubectl proxy
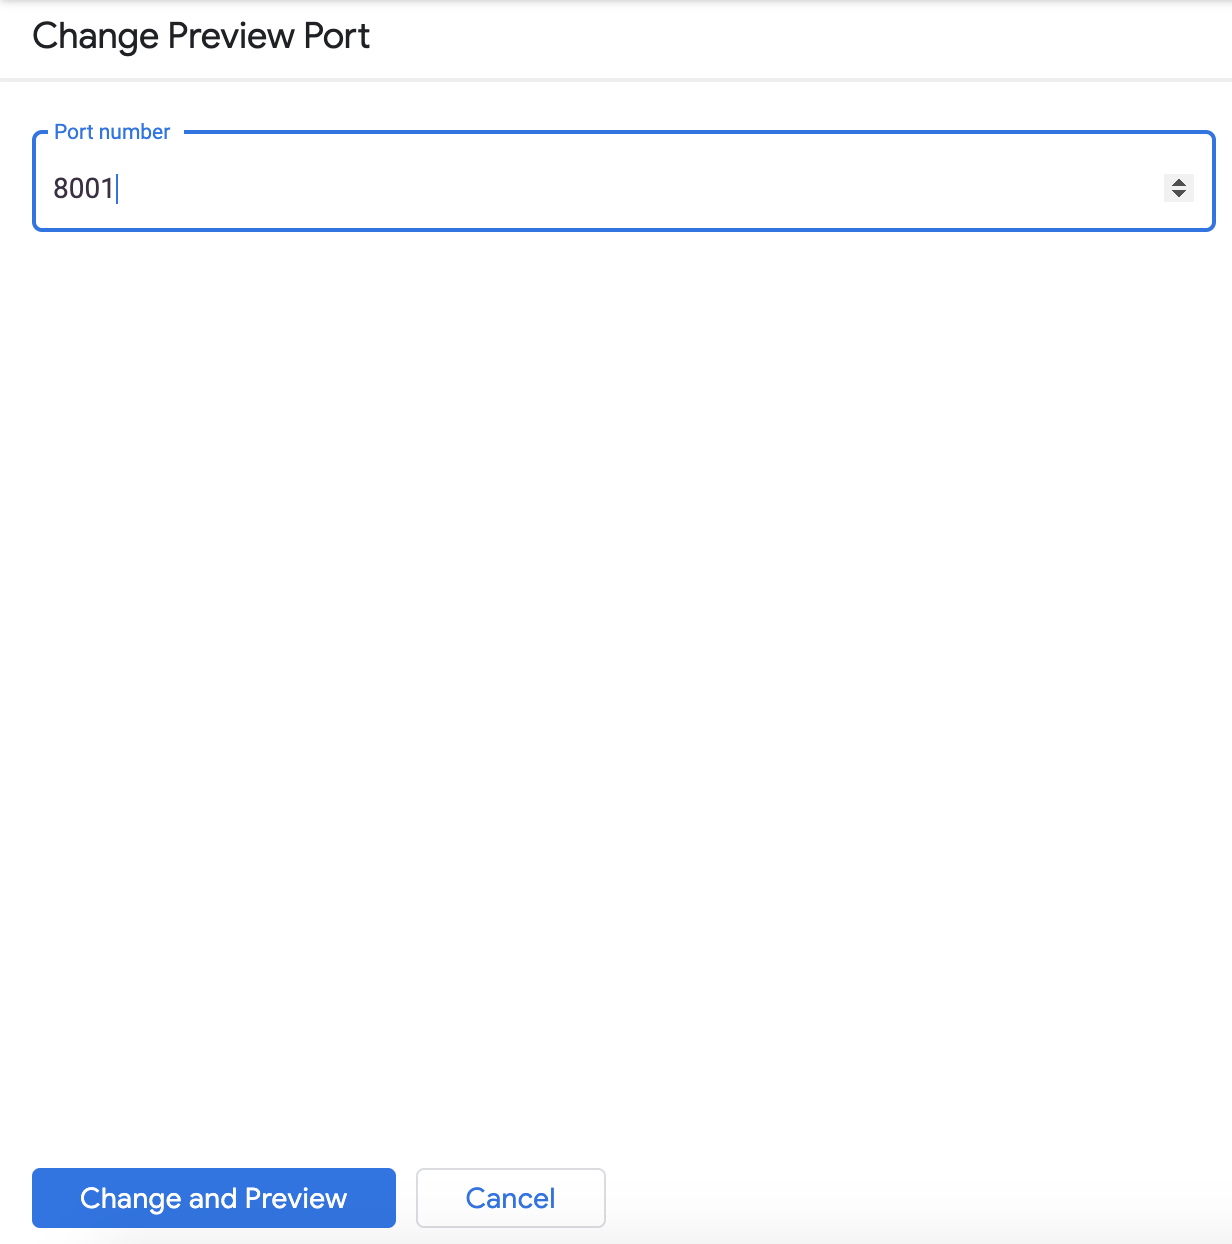
Starting to serve on 127.0.0.1:8001If everything works ok, open the Web Preview and click Change port.
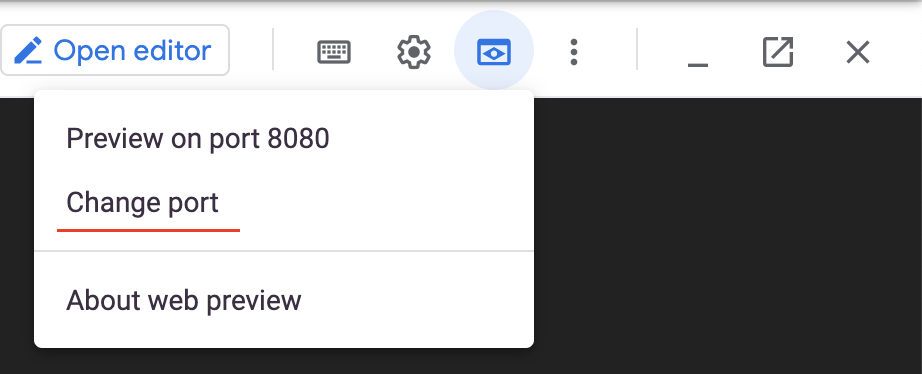
Enter 8001 and press Change and Preview.
You will be able to access the dashboard using the following link:
https://YOUR_CLOUD_SHELL_ADDRESS.cloudshell.dev/api/v1/namespaces/kubernetes-dashboard/services/https:kubernetes-dashboard:/proxy/
Paste the token you got previously. And depending on if you have metrics server or not - you will either see metrics in the dashboard or not.
Optional: Exposing the dashboard
Optionally, if you don't want to play with web preview, you can expose the dashboard to the outside world.
Install a Kubernetes supported NGINX Controller that can work with Google LoadBalancers.
$ kubectl apply -f https://raw.githubusercontent.com/kubernetes/ingress-nginx/controller-v0.40.2/deploy/static/provider/cloud/deploy.yamlNext, create the Ingress resource to expose the dashboard:
$ cat <<EOF | kubectl apply -f -
apiVersion: networking.k8s.io/v1beta1
kind: Ingress
metadata:
  name: dashboard-ingress
  namespace: kubernetes-dashboard
  annotations:
    kubernetes.io/ingress.class: nginx
    nginx.ingress.kubernetes.io/rewrite-target: /
    nginx.ingress.kubernetes.io/backend-protocol: "HTTPS"
    nginx.ingress.kubernetes.io/ssl-passthrough: "true"
spec:
  rules:
    - http:
        paths:
          - path: /
            backend:
              serviceName: kubernetes-dashboard
              servicePort: 443
EOF
Finally, get the address of the LoadBalancer:
$ export DASH_URL=`kubectl get svc ingress-nginx-controller -n ingress-nginx -o=jsonpath='{.status.loadBalancer.ingress[0].ip}'`
$ echo https://${DASH_URL}
Copy the URL printed in your shell and paste it in your browser.
When you reach the login page - paste the token from the previous section to log in.
Create Kubernetes Deployment
Enter the following command to run your Kubernetes deployment:
$ cat <<EOF | kubectl create -f -
apiVersion: apps/v1
kind: Deployment
metadata:
  name: devops-deployment
  labels:
    app: devops
    tier: frontend
spec:
  replicas: 3
  selector:
    matchLabels:
      app: devops
      tier: frontend
  template:
    metadata:
      labels:
        app: devops
        tier: frontend
    spec:
      containers:
      - name: devops-demo
        image: kennethreitz/httpbin
        ports:
        - containerPort: 80
EOF
Enter the following command to see if you have any instances of your application running.
$ kubectl get podsRun the command a few times until all the pods are running.
Enter the following to see the deployments.
$ kubectl get deploymentsNote the name of the deployment. This was specified in the configuration file.
Enter the following to see the details of your deployment.
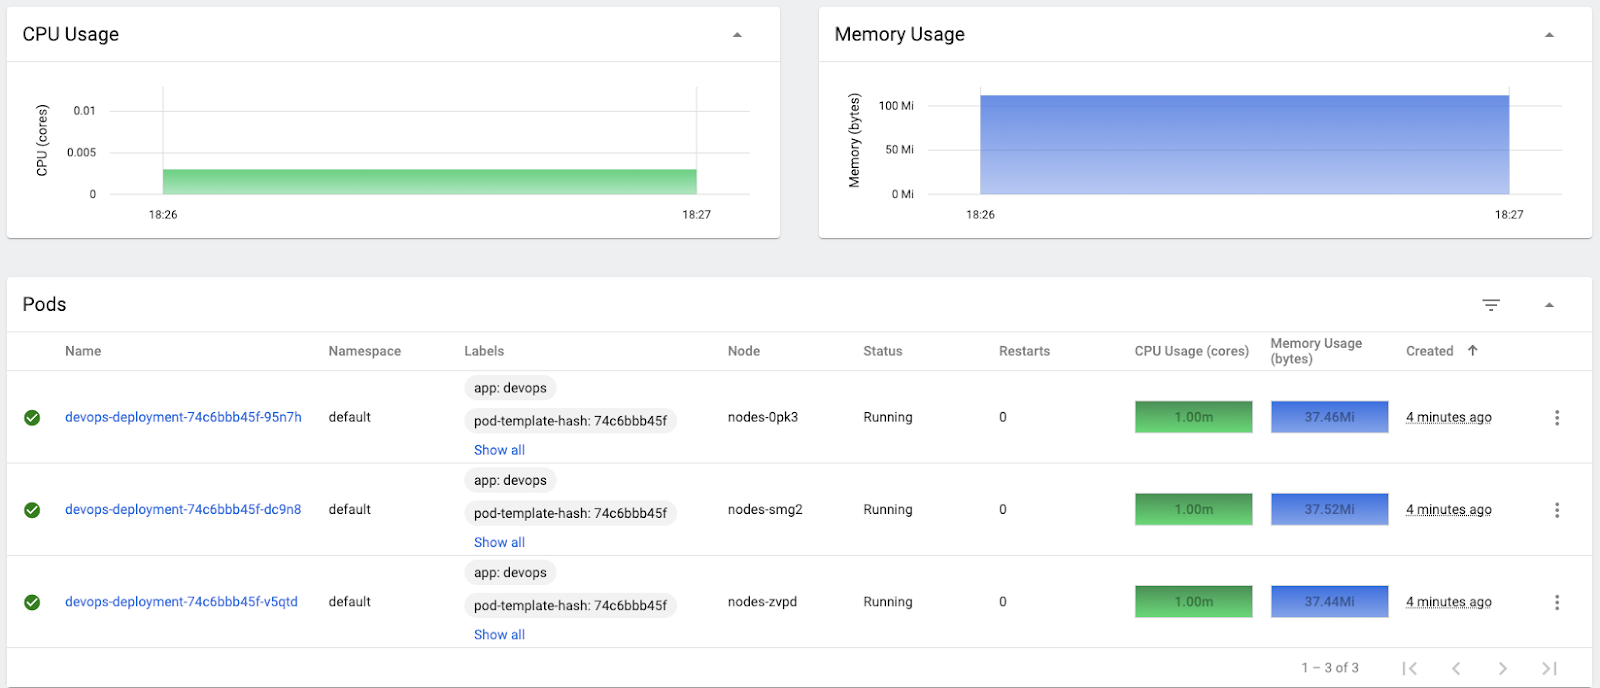
$ kubectl describe deployments devops-deploymentIn the Web Dashboard go to Workloads → Pods.
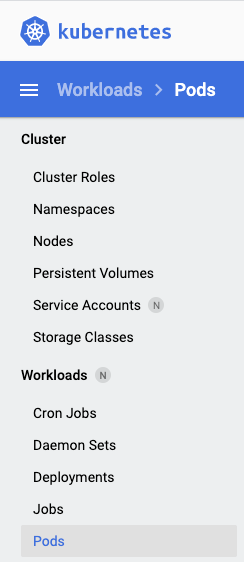
If you have enabled Metrics Server, then in about 2-3 minutes you should see CPU & Memory usages of your pods.
Expose the Deployment
You have application instances, but can't yet access them with a browser because they are not exposed outside of Kubernetes. Expose the application and create a load balancer with the following command.
$ kubectl expose deployment devops-deployment --port=80 --target-port=80 --type=LoadBalancerYou need the IP address of the load balancer. Type the following command to get it.
$ kubectl get servicesOnce you have an external IP address, curl the application.
$ export APP_URL=`kubectl get svc devops-deployment -o=jsonpath={.status.loadBalancer.ingress[0].ip}`
$ curl http://${APP_URL}/headersScale the Deployment
Let's scale up to 10 instances.
$ kubectl scale deployment devops-deployment --replicas=10After the command completes, type kubectl get pods to see if it worked. You might have to run the command a few times before all 10 are running.
Let's scale back to 3 instances.
$ kubectl scale deployment devops-deployment --replicas=3After the command completes, type kubectl get pods to see if it worked. You might have to run the command a few times.
Let's create a Horizontal Pod Autoscaler (HPA). It will allow us to scale the instances automatically depending on load. Type the following command.
$ kubectl autoscale deployment devops-deployment --min=5 --max=10 --cpu-percent=60Wait a little while and type kubectl get pods again. The autoscaler will create two more pods. As before, you might have to wait a little while and run the command a couple times.
Let's try to generate some load. First install Apache. Apache includes a testing tool called ApacheBench. It allows us to simulate load. If we send enough requests, we should get the pods to autoscale.
$ sudo apt install apache2 -yThen run the following command (probably multiple times) to get enough load. Make sure you have the ending slash! It will generate 500k requests, with 1k batches.
$ export APP_URL=`kubectl get svc devops-deployment -o=jsonpath={.status.loadBalancer.ingress[0].ip}`
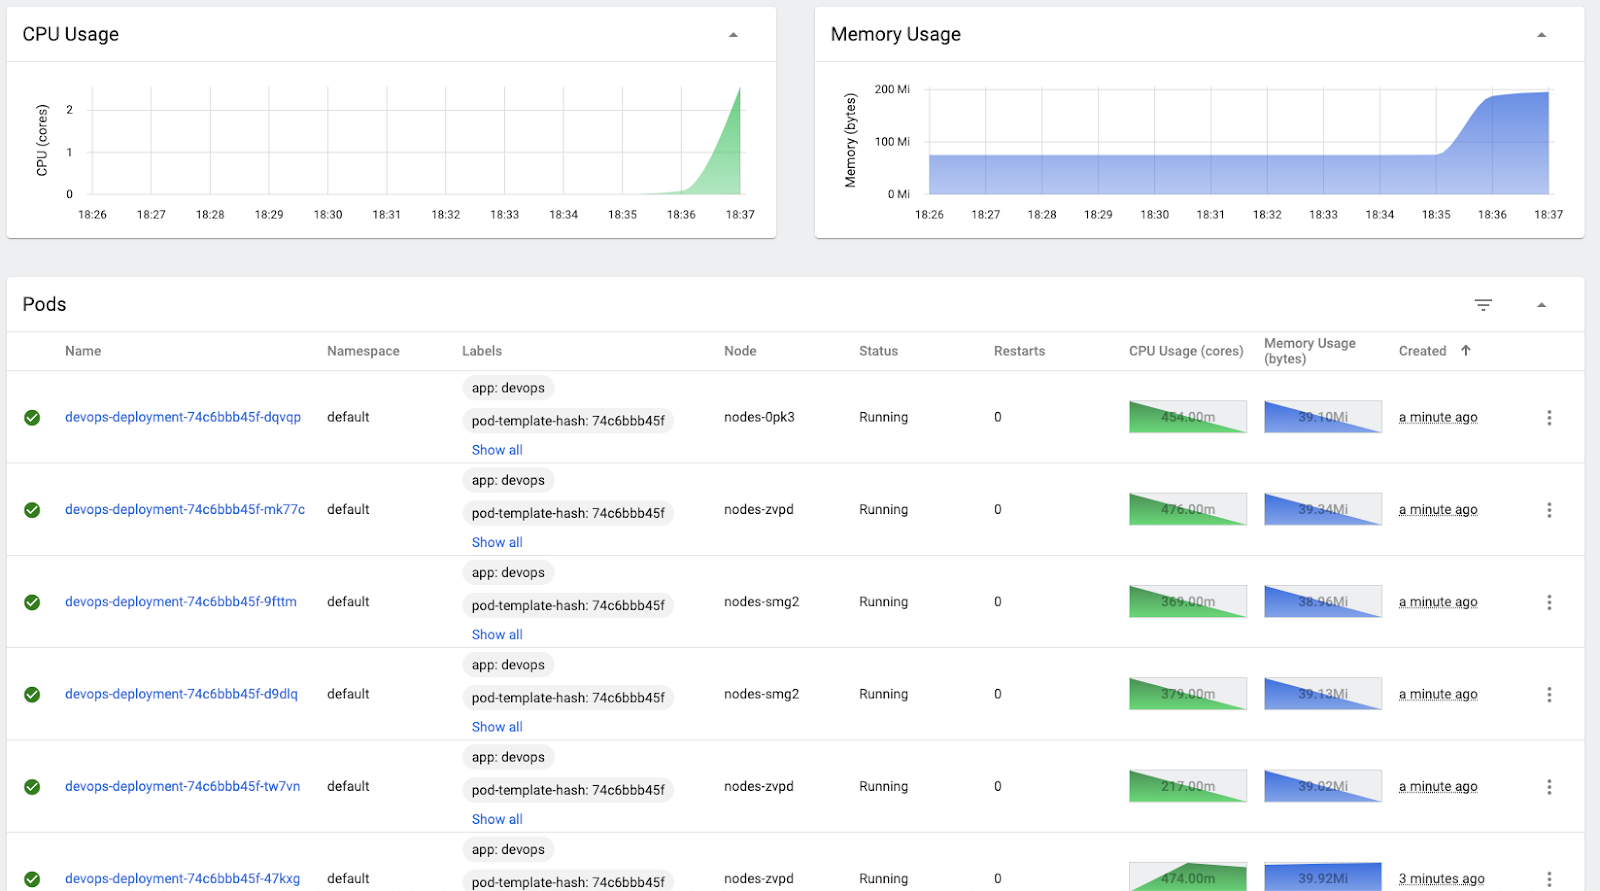
$ ab -n 500000 -c 1000 http://${APP_URL}/Run kubectl get pods after running ApacheBench to see if pods do scale.
In the Web Dashboard you should see a huge CPU & memory spike reflecting the increased load and more pods being created.
Wait for about 5 minutes after you've finished generating the requests. The pods should scale back to 5.
Delete the Deployment
It's just as easy to delete everything, as it is to create everything. Enter the following to delete the deployment. This will delete the deployment but not the cluster. We will delete the cluster shortly.
$ kubectl delete hpa devops-deployment
$ kubectl delete services devops-deployment
$ kubectl delete deployment devops-deployment
Wait a minute and then type kubectl get pods and kubectl get services to see if everything got deleted.
Changing the instance group size
First, check how the InstanceGroups for your nodes and for your masters are called.
$ kops get ig

NAME                    ROLE    MACHINETYPE     MIN     MAX     ZONES
master-europe-west3-a   Master  e2-small        1       1       europe-west3-a
master-europe-west3-b   Master  e2-small        1       1       europe-west3-b
master-europe-west3-c   Master  e2-small        1       1       europe-west3-c
nodes                   Node    e2-small        3       3       europe-west3-a,europe-west3-b,europe-west3-c
Let's change the number of nodes in the nodes instanceGroup to 4. Edit the InstanceGroup configuration:
$ kops edit ig nodesIt will open the InstanceGroup in your editor, looking a bit like this:
apiVersion: kops.k8s.io/v1alpha2
kind: InstanceGroup
metadata:
  labels:
    kops.k8s.io/cluster: mycoolcluster.k8s.local
  name: nodes
spec:
  image: cos-cloud/cos-stable-77-12371-114-0
  machineType: e2-small
  maxSize: 3
  minSize: 3
...
Edit minSize and maxSize, changing both from 3 to 4, save and exit your editor. If you wanted to change the image or the machineType, you could do that here as well (and we'll do it in a few minutes). There are actually a lot more fields, but most of them have their default values, so won't show up unless they are set. The general approach is the same though.
On saving you'll note that nothing happens. Although you've changed the model, you need to tell kops to apply your changes to the cloud.
First, lets preview what the changes will look like:
$ kops update cluster

...
Will modify resources:
  ...
  InstanceGroupManager/a-nodes-mycoolcluster-k8s-local
     ...
        TargetSize               1 -> 2
...
Kops will try to spread instances evenly across all selected zones (we have 3), but as we only have increased instanceGroup size by 1, it will select one of our managed instance groups and increase its size to 2.
Apply the changes:
$ kops update cluster --yesWithin ~ 2-5 minutes you should see the new node join:
$ kubectl get nodesInstance group rolling update
Changing the instance group size was a simple change, because we didn't have to reboot the nodes. Most changes to the node's configuration do require rolling your instances - this is actually a deliberate design decision, in that Kops is aiming for immutable nodes.
Let's try changing machineType to n1-standard-1. While we're doing it we will scale back the cluster.
Edit the InstanceGroup configuration:
$ kops edit ig nodesIt will open the InstanceGroup in your editor, modify it so the minSize, maxSize and machineType field look like the next snippet:
apiVersion: kops.k8s.io/v1alpha2
kind: InstanceGroup
metadata:
  labels:
    kops.k8s.io/cluster: mycoolcluster.k8s.local
  name: nodes
spec:
  image: cos-cloud/cos-stable-77-12371-114-0
  machineType: n1-standard-1
  maxSize: 3
  minSize: 3
...
Now preview will show that you're going to create a new GCE Instance Template, and that the Managed Instance Group is going to use it:
$ kops update cluster

...
  InstanceTemplate/nodes-mycoolcluster-k8s-local
        NamePrefix              nodes-mycoolcluster-k8s-local
        Network                 name:default id:default
        Preemptible             false
        ...
        Metadata                {cluster-name: <resource>, kops-k8s-io-instance-group-name: <resource>, startup-script: <resource>}
        MachineType             n1-standard-1
...
Note that the MachineType is indeed set to the n1-standard-1 as you configured.
Apply the changes:
$ kops update cluster --yesWithin ~ 2 minutes you should see that you scaled down to 3 nodes:
$ kubectl get nodesBut if you check the machine types using gcloud - you'll see that they are still the same (e2-small).
$ gcloud compute instances listThere's a hint at the bottom of kops update cluster command: "Changes may require instances to restart: kops rolling-update cluster"
These changes require your instances to restart (we'll remove the e2-small instances and replace them with n1-standard-1). Kops can perform a rolling update to minimize disruption.
To start the update:
$ kops rolling-update cluster --yesWhen the update is finished - check the machine types of the nodes:
$ gcloud compute instances listCreating and deleting instance groups
Suppose you want to add a new group of dedicated nodes for some specific workloads (like having GPUs for ML). We can add taints and labels during instance creation.
To create a new instance group run:
$ kops create ig gpu --subnet europe-west3The command opens an editor with a skeleton configuration, allowing you to edit it before creation. Completely replace it with the following configuration:
apiVersion: kops.k8s.io/v1alpha2
kind: InstanceGroup
metadata:
  creationTimestamp: null
  name: gpu
spec:
  image: cos-cloud/cos-stable-77-12371-114-0
  machineType: e2-small
  maxSize: 1
  minSize: 1
  taints:
  - gpu=nvidia:PreferNoSchedule
  nodeLabels:
    gpu: "true"
    cloud.google.com/metadata-proxy-ready: "true"
    kops.k8s.io/instancegroup: gpu
  role: Node
  subnets:
  - europe-west3
  zones:
  - europe-west3-a
Apply the changes :
$ kops update cluster --yesWait for about 2-5 minutes and deploy our "ML" workload:
$ cat <<EOF | kubectl create -f -
apiVersion: apps/v1
kind: Deployment
metadata:
  labels:
    run: hello-ml
  name: hello-ml
spec:
  replicas: 2
  selector:
    matchLabels:
      run: hello-ml
  template:
    metadata:
      labels:
        run: hello-ml
    spec:
      containers:
      - image: nginx
        name: hello-ml
        ports:
        - containerPort: 80
          protocol: TCP
        resources:
          requests:
            cpu: "50m"
      tolerations:
      - key: gpu
        operator: Equal
        value: nvidia
        effect: PreferNoSchedule
      nodeSelector:
        gpu: "true"
EOF
Check where the pods are running. Both replicas should be on our "gpu" node:
$ kubectl get pod -owide

NAME                       READY   STATUS    RESTARTS   AGE   IP           NODE
hello-ml-f587988bd-hxntm   1/1     Running   0          9s    100.96.6.2   gpu-8lt6
hello-ml-f587988bd-q5mq8   1/1     Running   0          9s    100.96.6.3   gpu-8lt6
Finally, delete the instanceGroup:
$ kops delete ig gpuTo delete the Ingress controller to terminate the LoadBalancer:
$ kubectl delete -f https://raw.githubusercontent.com/kubernetes/ingress-nginx/controller-v0.40.2/deploy/static/provider/cloud/deploy.yamlTo delete the cluster execute the following command.
$ kops delete cluster --name $NAME --yesWhen the cluster is removed - delete the bucket.
$ export PROJECT=`gcloud config get-value project`
$ gsutil rm -r gs://${PROJECT}-state-store/
Thank you! :)